 scale(1 -1)' gradientUnits='userSpaceOnUse'%3e%3cstop offset='0' stop-color='%23d257fc' /%3e%3cstop offset='.15' stop-color='%23b62dcc' /%3e%3cstop offset='.32' stop-color='%23909' /%3e%3cstop offset='.44' stop-color='%238312b6' /%3e%3cstop offset='.76' stop-color='%23503eff' /%3e%3c/linearGradient%3e%3c/defs%3e%3cg%3e%3cg%3e%3cpath fill='%23fff' d='M288.22,77.61c2.7-1.09,5.19-2.4,7.44-3.91,3.22-2.16,5.96-4.72,8.15-7.59,2.2-2.88,3.9-6.12,5.07-9.65,1.16-3.52,1.75-7.29,1.75-11.23,0-4.95-.86-9.56-2.57-13.71-1.73-4.21-4.49-7.87-8.18-10.88-3.65-2.97-8.36-5.31-14-6.94-5.57-1.61-12.32-2.43-20.06-2.43h-35.88V126.51h24.51v-43.55h6.98c2.15,0,3.24,.34,3.77,.62,.77,.41,1.51,1.16,2.21,2.23l23.43,35.68c1.03,1.58,2.33,2.83,3.84,3.69,1.54,.88,3.4,1.33,5.52,1.33h22.21l-29.9-44.11c-1.27-1.85-2.7-3.45-4.28-4.78Zm-33.77-46.52h11.37c7.17,0,12.52,1.39,15.88,4.12,3.29,2.68,4.89,6.46,4.89,11.56,0,2.58-.42,4.97-1.26,7.1-.81,2.08-2.07,3.91-3.72,5.42-1.67,1.53-3.86,2.76-6.49,3.65-2.69,.91-5.93,1.37-9.61,1.37h-11.06V31.09Z' /%3e%3cpath fill='%23fff' d='M386.19,53.94c-3.56-3.67-7.92-6.54-12.95-8.53-5.01-1.98-10.65-2.98-16.76-2.98s-11.77,1-16.8,2.98c-5.06,1.99-9.44,4.86-13.03,8.53-3.59,3.67-6.4,8.19-8.36,13.45-1.95,5.22-2.93,11.12-2.93,17.54s.99,12.39,2.93,17.61c1.96,5.26,4.77,9.81,8.35,13.52,3.59,3.73,7.98,6.63,13.04,8.62,5.03,1.98,10.68,2.98,16.8,2.98s11.76-1,16.76-2.98c5.04-1.99,9.4-4.89,12.96-8.62,3.56-3.72,6.34-8.27,8.27-13.53,1.92-5.22,2.89-11.14,2.89-17.61s-.97-12.31-2.89-17.53c-1.93-5.26-4.72-9.79-8.28-13.46Zm-16.65,49.47c-2.81,3.93-7.08,5.84-13.07,5.84s-10.43-1.92-13.27-5.88c-2.94-4.1-4.43-10.25-4.43-18.29s1.49-14.22,4.43-18.37c2.84-4,7.17-5.95,13.26-5.95s10.26,1.93,13.07,5.91c2.91,4.12,4.39,10.32,4.39,18.41s-1.48,14.25-4.39,18.33Z' /%3e%3cpath fill='%23fff' d='M462.91,102.23c-1.61,0-3.07,.51-4.36,1.52-.94,.74-2.04,1.54-3.27,2.41-1.16,.81-2.62,1.57-4.36,2.26-1.64,.65-3.89,.98-6.66,.98s-5.21-.52-7.36-1.55c-2.13-1.02-3.97-2.54-5.48-4.52-1.54-2.03-2.75-4.6-3.58-7.64-.85-3.11-1.28-6.73-1.28-10.75s.39-7.4,1.17-10.44c.76-2.96,1.91-5.5,3.43-7.56,1.47-2,3.35-3.55,5.58-4.62,2.25-1.08,4.93-1.63,7.97-1.63,2.4,0,4.42,.27,5.99,.79,1.64,.55,3.07,1.17,4.24,1.85,1.26,.73,2.35,1.39,3.25,1.96,1.23,.78,2.53,1.18,3.87,1.18,1.45,0,2.62-.34,3.49-1,.67-.51,1.33-1.18,2-2.03l6-8.3-1.14-1.14c-3.7-3.7-7.93-6.58-12.58-8.57-4.66-1.99-10.14-3-16.27-3-6.44,0-12.25,1.09-17.24,3.24-5.01,2.15-9.28,5.18-12.69,8.99-3.39,3.8-6,8.35-7.74,13.53-1.73,5.13-2.6,10.76-2.6,16.75,0,6.67,.99,12.71,2.93,17.96,1.95,5.27,4.65,9.8,8.01,13.45,3.38,3.68,7.4,6.52,11.95,8.44,4.53,1.91,9.42,2.88,14.53,2.88,2.85,0,5.77-.21,8.67-.64,2.95-.43,5.85-1.18,8.6-2.22,2.77-1.05,5.48-2.47,8.06-4.21,2.59-1.75,5.03-3.96,7.24-6.54l1.01-1.18-6.38-8.09c-1.12-1.67-2.85-2.55-5-2.55Z' /%3e%3cpath fill='%23fff' d='M529.12,81.74c-.39-.49-.81-.96-1.26-1.4,.43-.35,.85-.73,1.25-1.12,.97-.94,1.92-1.99,2.83-3.11l27.18-32.46h-21.46c-1.93,0-3.56,.39-4.83,1.16-1.15,.69-2.23,1.64-3.26,2.85l-19.63,24.25c-.81,.97-1.38,1.37-1.71,1.53-.25,.13-.87,.34-2.16,.34h-1.66V8.2h-22.81V126.51h22.81v-36.23h2.43c1.65,0,2.38,.23,2.67,.36,.25,.12,.78,.48,1.55,1.65l20.11,29.98c1,1.51,2.18,2.6,3.5,3.26,1.29,.64,2.84,.97,4.62,.97h20.77l-28.4-41.35c-.84-1.21-1.69-2.35-2.54-3.41Z' /%3e%3cpath fill='%23fff' d='M625.48,88.87c.94-.38,1.69-1.03,2.24-1.91,.48-.77,.79-1.75,.96-2.98,.14-1.04,.21-2.33,.21-3.84,0-5.91-.9-11.26-2.67-15.89-1.78-4.67-4.31-8.68-7.51-11.91-3.21-3.24-7.08-5.73-11.5-7.41-4.39-1.67-9.24-2.51-14.43-2.51-6.14,0-11.75,1.09-16.67,3.24-4.92,2.15-9.15,5.11-12.57,8.81-3.42,3.69-6.08,8.07-7.9,13.04-1.82,4.94-2.74,10.28-2.74,15.87,0,7.14,1.05,13.52,3.13,18.98,2.09,5.49,5,10.17,8.66,13.91,3.67,3.75,8.04,6.62,13,8.53,4.92,1.9,10.31,2.86,16.02,2.86,2.85,0,5.83-.21,8.85-.63,3.07-.43,6.12-1.17,9.07-2.21,2.98-1.05,5.87-2.46,8.6-4.2,2.76-1.76,5.29-3.97,7.51-6.57l1.01-1.19-6.47-8.09c-.58-.79-1.28-1.41-2.09-1.85-.84-.46-1.82-.69-2.91-.69-1.51,0-3.05,.45-4.6,1.33-1.23,.7-2.68,1.49-4.33,2.35-1.57,.82-3.44,1.58-5.56,2.27-2.03,.66-4.52,.99-7.4,.99-5.8,0-10.31-1.68-13.77-5.15-3.14-3.14-5.1-8.07-5.82-14.66h46.8c1.13,0,2.07-.16,2.87-.49Zm-49.09-14.77c.94-4.29,2.65-7.68,5.08-10.11,2.79-2.79,6.62-4.15,11.69-4.15,2.54,0,4.77,.42,6.62,1.26,1.84,.83,3.38,1.97,4.58,3.39,1.21,1.44,2.13,3.15,2.72,5.08,.44,1.43,.72,2.95,.85,4.54h-31.54Z' /%3e%3cpath fill='%23fff' d='M681.7,108.6l-.08-.12c-.52-.71-1.01-1.25-1.52-1.65-1.27-.99-3.22-1.16-4.92-.12-.43,.26-.92,.54-1.47,.82-.51,.27-1.13,.53-1.84,.78-.59,.21-1.37,.31-2.34,.31-1.53,0-2.65-.46-3.52-1.45-.91-1.03-1.37-2.55-1.37-4.53V61.69h20.81v-17.34h-20.81V19.45h-11.75c-1.55,0-2.88,.41-3.95,1.23-1.12,.85-1.84,2.04-2.14,3.55l-3.77,20.28-12.99,2.13v9.16c0,1.89,.59,3.37,1.75,4.41,1.1,.98,2.41,1.48,3.92,1.48h6.13v42.28c0,7.3,2.04,13.15,6.07,17.37,4.05,4.25,9.83,6.4,17.17,6.4,4.04,0,8-.63,11.77-1.87,3.81-1.25,7.23-3.13,10.18-5.58l1.26-1.05-6.56-10.64Z' /%3e%3c/g%3e%3cg%3e%3cpath fill='%23fff' d='M255.78,168.38c-.2,.4-.51,.6-.94,.6-.31,0-.72-.18-1.21-.53-.5-.35-1.15-.75-1.96-1.19-.81-.44-1.8-.84-2.98-1.19-1.18-.35-2.62-.53-4.32-.53-1.53,0-2.93,.22-4.19,.66-1.26,.44-2.34,1.03-3.24,1.76-.89,.74-1.59,1.59-2.09,2.57-.5,.98-.75,2-.75,3.08,0,1.33,.34,2.43,1.02,3.31,.68,.88,1.57,1.63,2.68,2.25,1.11,.62,2.36,1.16,3.77,1.61,1.4,.45,2.85,.91,4.32,1.36,1.48,.45,2.92,.96,4.32,1.51,1.4,.55,2.66,1.24,3.77,2.07,1.11,.82,2,1.83,2.68,3.02,.68,1.19,1.02,2.64,1.02,4.34,0,1.85-.33,3.56-1,5.15-.67,1.59-1.63,2.97-2.9,4.13-1.26,1.16-2.82,2.09-4.66,2.77-1.85,.68-3.95,1.02-6.3,1.02-2.98,0-5.55-.48-7.71-1.43-2.16-.95-4.09-2.19-5.79-3.73l.98-1.45c.14-.23,.3-.4,.47-.51,.17-.11,.41-.17,.72-.17,.37,0,.82,.23,1.36,.68s1.24,.94,2.11,1.47c.87,.53,1.94,1.02,3.24,1.47s2.89,.68,4.79,.68c1.79,0,3.36-.25,4.73-.75,1.36-.5,2.5-1.17,3.41-2.02s1.6-1.85,2.07-3,.7-2.36,.7-3.64c0-1.42-.34-2.6-1.02-3.53-.68-.94-1.58-1.73-2.68-2.38-1.11-.65-2.36-1.21-3.77-1.66-1.41-.45-2.85-.91-4.34-1.36s-2.94-.95-4.34-1.49c-1.4-.54-2.66-1.22-3.77-2.04-1.11-.82-2-1.82-2.68-3-.68-1.18-1.02-2.65-1.02-4.41,0-1.5,.33-2.95,.98-4.34,.65-1.39,1.58-2.61,2.79-3.66,1.21-1.05,2.68-1.89,4.41-2.51,1.73-.62,3.68-.94,5.83-.94,2.58,0,4.88,.37,6.88,1.12,2,.75,3.84,1.89,5.51,3.43l-.89,1.41Z' /%3e%3cpath fill='%23fff' d='M306.06,162.42c3.04,0,5.76,.52,8.15,1.55,2.4,1.04,4.42,2.51,6.07,4.41,1.65,1.9,2.9,4.19,3.77,6.88,.87,2.68,1.3,5.68,1.3,9.01s-.43,6.32-1.3,8.98c-.87,2.67-2.12,4.95-3.77,6.86-1.65,1.9-3.67,3.36-6.07,4.39-2.4,1.02-5.12,1.53-8.15,1.53s-5.76-.51-8.15-1.53c-2.4-1.02-4.43-2.48-6.09-4.39-1.66-1.9-2.92-4.19-3.79-6.86-.87-2.67-1.3-5.66-1.3-8.98s.43-6.32,1.3-9.01c.87-2.68,2.13-4.97,3.79-6.88,1.66-1.9,3.69-3.37,6.09-4.41,2.4-1.04,5.12-1.55,8.15-1.55Zm0,40.41c2.53,0,4.73-.43,6.62-1.3,1.89-.87,3.46-2.11,4.73-3.73,1.26-1.62,2.21-3.57,2.83-5.85,.62-2.29,.94-4.85,.94-7.69s-.31-5.37-.94-7.66c-.63-2.3-1.57-4.26-2.83-5.9-1.26-1.63-2.84-2.89-4.73-3.77-1.89-.88-4.1-1.32-6.62-1.32s-4.73,.44-6.62,1.32c-1.89,.88-3.46,2.14-4.73,3.77-1.26,1.63-2.21,3.6-2.85,5.9-.64,2.3-.96,4.85-.96,7.66s.32,5.4,.96,7.69c.64,2.29,1.59,4.24,2.85,5.85,1.26,1.62,2.84,2.86,4.73,3.73,1.89,.87,4.09,1.3,6.62,1.3Z' /%3e%3cpath fill='%23fff' d='M358.95,205.47v-37.94l-5.96-.38c-.82-.06-1.23-.41-1.23-1.06v-1.66h7.2v-5.36c0-2.41,.31-4.54,.94-6.37,.62-1.83,1.5-3.36,2.64-4.58,1.13-1.22,2.5-2.14,4.11-2.75,1.6-.61,3.37-.92,5.3-.92,.88,0,1.77,.08,2.66,.23,.89,.16,1.68,.38,2.36,.66l-.13,1.96c-.03,.4-.3,.6-.81,.6-.34,0-.8-.04-1.38-.13s-1.3-.13-2.15-.13c-1.39,0-2.68,.21-3.85,.62-1.18,.41-2.19,1.07-3.04,1.98s-1.51,2.09-1.98,3.56c-.47,1.46-.7,3.26-.7,5.39v5.24h13.75v3.02h-13.67v38.02h-4.05Z' /%3e%3cpath fill='%23fff' d='M419.75,206.15c-2.87,0-5.1-.79-6.68-2.38-1.59-1.59-2.38-4.04-2.38-7.37v-28.95h-6.09c-.31,0-.57-.09-.77-.26s-.3-.41-.3-.72v-1.58l7.24-.51,1.01-15.16c.03-.25,.13-.48,.32-.68,.18-.2,.43-.3,.74-.3h1.89v16.18h13.33v3.02h-13.33v28.74c0,1.16,.15,2.17,.45,3,.3,.84,.71,1.53,1.23,2.07,.52,.54,1.14,.94,1.85,1.19,.71,.26,1.48,.38,2.3,.38,1.02,0,1.9-.15,2.64-.45,.74-.3,1.38-.62,1.92-.98,.54-.35,.98-.68,1.32-.98,.34-.3,.61-.45,.81-.45,.23,0,.45,.14,.68,.43l1.11,1.79c-1.08,1.19-2.45,2.15-4.11,2.87-1.66,.72-3.38,1.09-5.17,1.09Z' /%3e%3cpath fill='%23fff' d='M453.22,163.1h3.11c.4,0,.72,.11,.98,.32,.26,.21,.43,.45,.51,.7l10.69,33.43c.2,.65,.35,1.28,.47,1.87,.11,.6,.23,1.19,.34,1.79,.14-.6,.3-1.19,.47-1.79,.17-.6,.37-1.22,.6-1.87l11.37-33.72c.2-.62,.6-.94,1.19-.94h1.66c.62,0,1.04,.31,1.23,.94l11.2,33.72c.43,1.28,.77,2.51,1.02,3.7,.11-.6,.23-1.2,.36-1.81,.13-.61,.31-1.24,.53-1.89l10.73-33.43c.23-.68,.71-1.02,1.45-1.02h2.98l-14.18,42.37h-2.98c-.45,0-.78-.3-.98-.89l-11.63-34.4c-.14-.43-.27-.85-.38-1.28-.11-.43-.21-.85-.3-1.28-.09,.43-.18,.85-.28,1.28-.1,.43-.22,.85-.36,1.28l-11.75,34.4c-.17,.6-.51,.89-1.02,.89h-2.85l-14.18-42.37Z' /%3e%3cpath fill='%23fff' d='M568.48,205.47c-.85,0-1.38-.4-1.58-1.19l-.6-5.41c-1.16,1.13-2.32,2.16-3.47,3.07-1.15,.91-2.35,1.67-3.6,2.3-1.25,.62-2.6,1.1-4.05,1.43-1.45,.33-3.04,.49-4.77,.49-1.45,0-2.85-.21-4.22-.64-1.36-.43-2.57-1.08-3.62-1.96-1.05-.88-1.89-2.01-2.53-3.39-.64-1.38-.96-3.03-.96-4.96,0-1.79,.51-3.45,1.53-4.98,1.02-1.53,2.62-2.87,4.79-4,2.17-1.14,4.97-2.04,8.39-2.73,3.42-.68,7.53-1.08,12.33-1.19v-4.43c0-3.92-.84-6.93-2.53-9.05-1.69-2.11-4.19-3.17-7.52-3.17-2.04,0-3.78,.28-5.22,.85-1.43,.57-2.65,1.19-3.64,1.87-.99,.68-1.8,1.31-2.43,1.87-.62,.57-1.15,.85-1.58,.85-.57,0-.99-.25-1.28-.77l-.72-1.23c2.21-2.21,4.54-3.89,6.98-5.02,2.44-1.14,5.21-1.7,8.3-1.7,2.27,0,4.26,.36,5.96,1.09s3.11,1.76,4.24,3.11c1.12,1.35,1.97,2.98,2.53,4.9,.57,1.92,.85,4.05,.85,6.41v27.59h-1.62Zm-17.03-2.26c1.65,0,3.16-.18,4.54-.53,1.38-.35,2.65-.85,3.83-1.49s2.28-1.4,3.3-2.28c1.02-.88,2.03-1.83,3.02-2.85v-11.03c-4.03,.11-7.5,.42-10.41,.92s-5.31,1.17-7.2,2.02-3.28,1.87-4.17,3.04c-.89,1.18-1.34,2.52-1.34,4.02,0,1.42,.23,2.65,.7,3.68,.47,1.04,1.09,1.89,1.85,2.55,.77,.67,1.66,1.16,2.68,1.47,1.02,.31,2.09,.47,3.19,.47Z' /%3e%3cpath fill='%23fff' d='M603.74,205.47v-42.37h2.13c.48,0,.83,.1,1.04,.3,.21,.2,.33,.54,.36,1.02l.34,8.94c1.36-3.43,3.18-6.12,5.45-8.07,2.27-1.94,5.07-2.92,8.39-2.92,1.28,0,2.45,.13,3.53,.4s2.1,.66,3.07,1.17l-.55,2.81c-.09,.45-.37,.68-.85,.68-.17,0-.41-.06-.72-.17-.31-.11-.7-.24-1.17-.38s-1.04-.27-1.72-.38c-.68-.11-1.46-.17-2.34-.17-3.21,0-5.84,.99-7.9,2.98-2.06,1.99-3.73,4.85-5,8.6v27.55h-4.04Z' /%3e%3cpath fill='%23fff' d='M668.25,162.42c2.38,0,4.59,.41,6.62,1.23s3.79,2.02,5.28,3.6c1.49,1.57,2.65,3.51,3.49,5.81,.84,2.3,1.26,4.94,1.26,7.92,0,.63-.09,1.05-.28,1.28s-.47,.34-.87,.34h-30.57v.81c0,3.18,.37,5.98,1.11,8.39,.74,2.41,1.79,4.44,3.15,6.07,1.36,1.63,3.01,2.86,4.94,3.68,1.93,.82,4.09,1.23,6.47,1.23,2.13,0,3.97-.23,5.54-.7s2.87-.99,3.94-1.57c1.06-.58,1.91-1.11,2.53-1.58s1.08-.7,1.36-.7c.37,0,.65,.14,.85,.43l1.11,1.36c-.68,.85-1.58,1.65-2.7,2.38-1.12,.74-2.37,1.37-3.75,1.89s-2.85,.94-4.43,1.26c-1.58,.31-3.16,.47-4.75,.47-2.9,0-5.54-.5-7.92-1.51s-4.43-2.48-6.14-4.41c-1.71-1.93-3.03-4.29-3.96-7.09-.93-2.8-1.4-6-1.4-9.6,0-3.04,.43-5.84,1.3-8.41,.87-2.57,2.11-4.78,3.75-6.64,1.63-1.86,3.63-3.31,6-4.36,2.37-1.05,5.06-1.58,8.07-1.58Zm.06,3.02c-2.18,0-4.14,.34-5.87,1.02-1.73,.68-3.22,1.66-4.49,2.94-1.26,1.28-2.28,2.81-3.06,4.6-.78,1.79-1.3,3.79-1.55,6h27.89c0-2.27-.31-4.31-.93-6.11-.62-1.8-1.5-3.33-2.64-4.58s-2.49-2.21-4.08-2.87c-1.59-.67-3.34-1-5.27-1Z' /%3e%3c/g%3e%3cpath fill='url(%23BLAST)' fill-rule='evenodd' d='M4.12,92.96c-1.43-.39-2.64-1.32-3.38-2.6-.74-1.28-.93-2.8-.55-4.23,.39-1.43,1.32-2.64,2.6-3.38,1.28-.74,2.8-.93,4.23-.55l50.57,13.55h0c3.17,.87,6.52,.91,9.71,.08l.28-.07c3.05-.91,5.82-2.58,8.05-4.86l.02,.02L156.93,9.65c1.05-1.05,2.46-1.63,3.94-1.63s2.9,.59,3.94,1.63c1.05,1.05,1.63,2.46,1.63,3.94s-.59,2.9-1.63,3.94L83.55,98.8v.02c-3.58,3.64-8.06,6.28-12.98,7.69-.13,.04-.25,.08-.38,.12-5.07,1.34-10.4,1.31-15.46-.09h0S4.12,92.96,4.12,92.96Zm18.81-18.77l25.88,6.93c5.06,1.41,10.4,1.43,15.47,.08,5.07-1.36,9.69-4.05,13.37-7.79l33.19-33.19c1.05-1.05,1.64-2.48,1.64-3.96s-.59-2.91-1.64-3.96-2.48-1.64-3.96-1.64-2.91,.59-3.96,1.64l-33.19,33.19c-2.47,2.47-5.32,4.13-8.36,4.95-3.04,.81-6.33,.8-9.69-.1l-25.87-6.93c-.71-.2-1.46-.26-2.2-.17-.74,.09-1.45,.32-2.09,.69-.65,.37-1.21,.86-1.66,1.45-.45,.59-.79,1.26-.98,1.98-.19,.72-.24,1.47-.14,2.2,.1,.74,.35,1.44,.73,2.08,.38,.64,.88,1.2,1.47,1.64,.6,.44,1.27,.76,1.99,.94Zm101.03,124.93l-13.55-50.57c-.88-3.17-.92-6.52-.09-9.7l.07-.29c.9-3.05,2.57-5.83,4.84-8.06L196.5,49.22c1.05-1.05,1.63-2.46,1.63-3.94s-.59-2.9-1.63-3.94c-1.05-1.05-2.46-1.63-3.94-1.63-1.48,0-2.9,.59-3.94,1.63L107.36,122.6c-3.65,3.59-6.3,8.06-7.71,12.97-.04,.13-.08,.25-.12,.38-1.34,5.07-1.31,10.4,.09,15.46h.01l13.56,50.61c.39,1.43,1.32,2.64,2.6,3.38,1.28,.74,2.8,.93,4.23,.55,1.43-.39,2.64-1.32,3.38-2.6,.74-1.28,.93-2.8,.55-4.23h0Zm18.79-18.79l-6.93-25.86c-.88-3.17-.92-6.52-.09-9.71l.07-.28c.91-3.05,2.58-5.82,4.86-8.05l33.2-33.19c1.05-1.05,1.64-2.48,1.64-3.96s-.59-2.91-1.64-3.96c-1.05-1.05-2.48-1.64-3.96-1.64s-2.91,.59-3.96,1.64l-33.18,33.2c-3.64,3.6-6.29,8.07-7.69,12.99-.04,.12-.08,.25-.12,.38-1.34,5.07-1.31,10.4,.09,15.46h.01l6.94,25.9c.19,.71,.52,1.37,.97,1.95,.45,.58,1,1.07,1.64,1.43,.63,.37,1.34,.6,2.06,.7,.73,.09,1.46,.04,2.17-.15,.71-.19,1.37-.52,1.95-.97s1.07-1,1.43-1.64c.36-.63,.6-1.34,.69-2.06,.09-.73,.04-1.46-.15-2.17h0ZM185.84,12.4L16.74,181.48c-1.05,1.05-1.64,2.48-1.64,3.96s.59,2.91,1.64,3.96c1.05,1.05,2.48,1.64,3.96,1.64s2.91-.59,3.96-1.64L193.75,20.31c1.03-1.05,1.6-2.47,1.59-3.94-.01-1.47-.6-2.88-1.64-3.92-1.04-1.04-2.45-1.63-3.92-1.64-1.47-.01-2.89,.56-3.94,1.59ZM51.18,115.37L15.8,150.75c-1.05,1.05-1.64,2.48-1.64,3.96,0,1.49,.59,2.91,1.64,3.96,1.05,1.05,2.48,1.64,3.96,1.64,1.49,0,2.91-.59,3.96-1.64l35.37-35.38c.52-.52,.93-1.14,1.22-1.82,.28-.68,.43-1.41,.43-2.14s-.14-1.47-.43-2.15c-.28-.68-.69-1.3-1.22-1.82-.52-.52-1.14-.93-1.82-1.22-.68-.28-1.41-.43-2.15-.43s-1.47,.15-2.15,.43c-.68,.28-1.3,.7-1.82,1.22v.02Zm31.7,31.68l-35.38,35.39c-1.05,1.05-1.64,2.48-1.64,3.96,0,1.49,.59,2.91,1.64,3.96,1.05,1.05,2.48,1.64,3.96,1.64,1.49,0,2.91-.59,3.96-1.64l35.37-35.39c1.03-1.06,1.6-2.47,1.59-3.94-.01-1.47-.6-2.88-1.64-3.92s-2.45-1.63-3.92-1.64c-1.47,0-2.89,.56-3.94,1.59Z' /%3e%3c/g%3e%3cpath fill='%23fff' d='M679.92,14.02c0-1.29,.17-2.53,.5-3.73,.33-1.19,.8-2.31,1.41-3.35,.61-1.04,1.34-1.98,2.19-2.83,.85-.85,1.8-1.58,2.84-2.19,1.03-.61,2.15-1.08,3.33-1.42,1.19-.33,2.43-.5,3.72-.5s2.53,.17,3.73,.5c1.19,.33,2.31,.8,3.34,1.42,1.04,.61,1.98,1.34,2.84,2.19s1.59,1.79,2.19,2.83c.61,1.04,1.08,2.16,1.41,3.35,.33,1.19,.5,2.44,.5,3.73s-.17,2.51-.5,3.71c-.33,1.19-.8,2.31-1.41,3.34-.61,1.03-1.34,1.98-2.19,2.83-.86,.85-1.8,1.58-2.84,2.19-1.03,.61-2.15,1.09-3.34,1.42-1.2,.33-2.44,.5-3.73,.5s-2.53-.17-3.72-.5c-1.19-.33-2.3-.8-3.33-1.42-1.04-.61-1.98-1.34-2.84-2.19-.86-.85-1.59-1.79-2.19-2.83-.61-1.03-1.08-2.14-1.41-3.33-.33-1.19-.5-2.43-.5-3.72Zm1.92,0c0,1.14,.14,2.23,.42,3.28,.28,1.05,.68,2.03,1.21,2.94,.52,.91,1.15,1.74,1.88,2.48,.73,.74,1.54,1.38,2.43,1.91s1.86,.94,2.89,1.23c1.04,.29,2.11,.43,3.24,.43,1.69,0,3.27-.32,4.74-.96s2.76-1.51,3.85-2.61c1.09-1.1,1.96-2.4,2.59-3.89,.63-1.49,.95-3.09,.95-4.8,0-1.14-.14-2.23-.43-3.29-.29-1.06-.69-2.05-1.22-2.96s-1.15-1.75-1.89-2.5c-.73-.75-1.55-1.39-2.44-1.92-.89-.53-1.86-.94-2.9-1.24-1.04-.29-2.12-.44-3.25-.44-1.69,0-3.26,.32-4.73,.97-1.47,.65-2.75,1.53-3.83,2.64-1.09,1.12-1.94,2.43-2.57,3.93s-.94,3.11-.94,4.82Zm9.31,1.72v6.78h-2.99V5.44h5.52c2.2,0,3.83,.4,4.89,1.2s1.59,1.97,1.59,3.53c0,1.2-.34,2.22-1.03,3.06s-1.7,1.42-3.06,1.74c.22,.13,.41,.29,.57,.48s.31,.42,.45,.67l4.37,6.4h-2.84c-.42,0-.73-.16-.94-.48l-3.85-5.78c-.11-.17-.25-.29-.41-.38-.16-.09-.41-.13-.74-.13h-1.53Zm0-2.18h2.22c.7,0,1.3-.07,1.79-.2,.49-.13,.89-.33,1.19-.58,.3-.26,.52-.57,.65-.94,.13-.37,.2-.8,.2-1.28s-.06-.89-.18-1.25c-.12-.36-.32-.65-.59-.88s-.64-.4-1.08-.52c-.45-.11-1-.17-1.67-.17h-2.53v5.82Z' /%3e%3c/svg%3e)
Regions overview is the central monitoring and control hub for C\Prof Web UI. Whilst navigating C\Prof Web UI, you can return to this screen at any time by clicking the home button ( ). From Regions overview you can monitor and record trace data from your CICS regions using either the card layout or the table layout. Each layout provides a similar functionality but presents the status of your CICS regions in different ways.
Card layout
The card layout displays your monitored CICS regions as cards containing a graph of transaction activity. When you start the C\Prof web user interface, the card layout is selected by default. If you are in the table layout, you can switch back to the card layout by clicking the card layout button ( ).
).
The CICS region card
A card displays the following information:
- The CICS region's application ID (APPLID)
- Collection status (both written and color-coded)
- CICS region information, including the CICS version, the LPAR that the CICS region is executing on, the job name, and the job ID.
- A graph showing the number of transactions attached and the number of transactions collected in the CICS region, or, if no graph is displayed, a message containing additional information. For a complete list of error messages and codes, see Messages and Codes.
- Snapshot, transaction analysis, and recording buttons.
Color coding
The color coding beneath the action buttons on a card indicates the current collection status. The card can display one of the following colors:
- Clear (white): The CICS region is eligible for profiling. No collection is taking place.
- Green: Record for profiling is active.
- Yellow: A collection warning message has been reported on this CICS region. Review the error messages for more information.
- Red: A collection error message has been reported on this CICS region. Review the error message for more information.
Groups
Cards are organized into groups defined in your C\Prof collection server configuration file. Actions that apply to all members of a group are displayed in the group action bar at the top of the group.
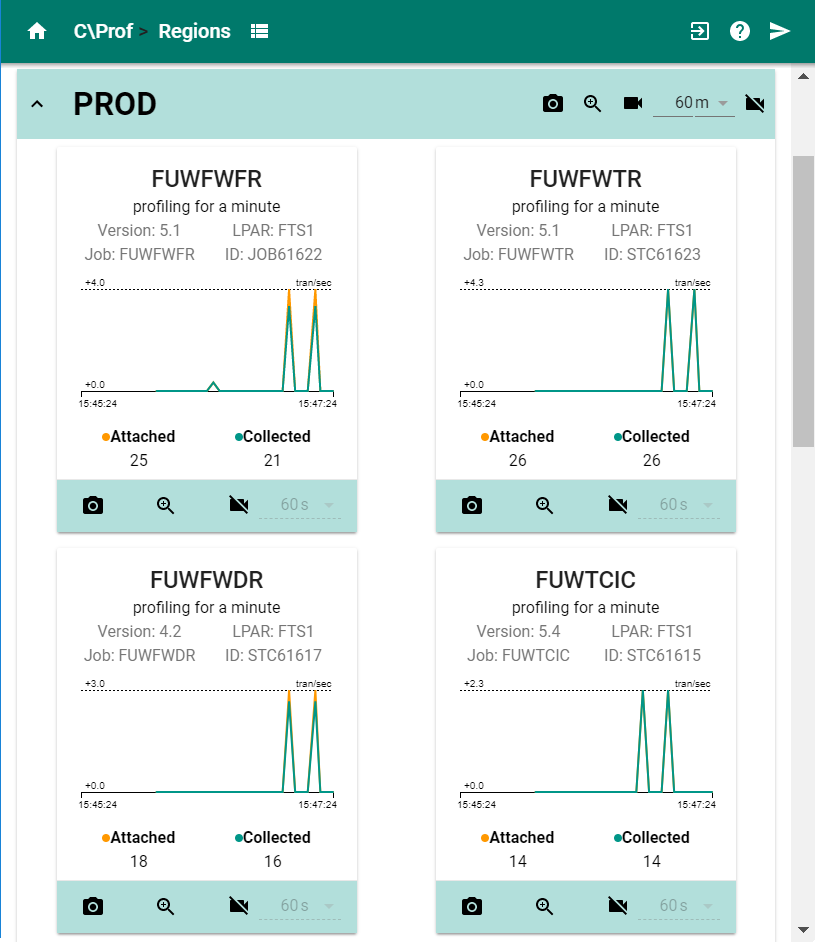 C\Prof card layout
Note: To limit the performance impact on your web browser, the C\Prof Web UI places a limit on the number of CICS regions it will display. Use filtering to drill down to the regions you are interested in. For more information, see Using the region filter.
Table layout
The table layout displays your monitored CICS regions in a more compact form by organizing them in a table. To open the table layout, click the table layout button ( ). To access the trace collection and transaction analysis action buttons for a CICS region, find the region you are interested in and then click the expand button (
 ). To hide the action buttons, click the collapse button (
 ).
).
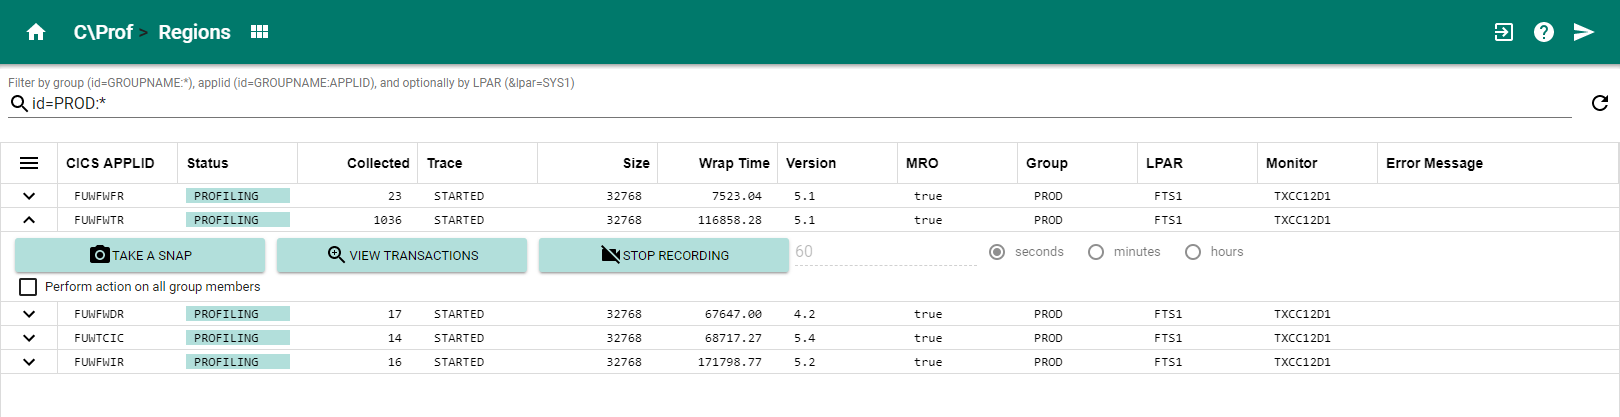 C\Prof table layout
Columns available in the table layout
The following columns are available in table layout. See Column configurations to configure your column settings.
| Column name | Meaning |
|---|---|
| CICS APPLID | CICS region generic application ID |
| Attached | Total number of transactions attached by CICS |
| Buffers | The number of trace buffers processed (collected) during trace collection |
| Collected | Number of transactions collected |
| Version | CICS version |
| Error Code | Displays C\Prof collector message codes. Refer to Messages and Codes for more information. |
| Error Message | Message associated with the completion of the last request |
| Group | Group that the CICS region belongs to as defined in your C\Prof configuration file |
| Group ID | The ID number of the group |
| Unique ID | The C\Prof Unique ID for the CICS region |
| JobID | CICS region Job ID |
| Jobname | CICS region Job name |
| Levels | Trace domain levels set in the CICS internal trace |
| LPAR | LPAR where the CICS region is executing |
| Monitor | The C\Prof collection server that is monitoring this CICS region |
| MRO | Indicates if this region belongs to a multiregion operation (MRO) group |
| Size | Size of the CICS internal trace table |
| Snap Count | Number of snapshots attempted in the CICS region |
| Status | Current status of C\Prof activity against the region: READY The CICS region is eligible for profiling PENDING A collection request is about to start PROFILING Recording for profiling is active SNAPPED The internal trace has been snapped. WARNING The most recent request ended with a warning ERROR The most request ended with an error |
| Sysplex | Sysplex that the LPAR belongs to |
| Trace | Current status of the CICS internal trace table. STARTED Internal Trace Status is STARTED STOPPED Internal Trace Status is STOPPED OFF Master System Trace Flag is OFF |
| Uptime | The time (in seconds) since the system was started |
| Wrap Time | Estimated time for the internal trace to wrap |
Using the region filter
Use the region filter in either the card layout or the table layout to restrict the display and show only those CICS regions of interest to you. To filter CICS regions, enter your filtering criteria beside the search icon ( ).
).
Filters can be specified using one of the following formats:
-
id=GROUP:APPLID
Show CICS regions by group and application id.
The GROUP parameter may one of the following:
- The name of the group. Group names are defined in your C\Prof configuration file.
- A single asterisk (*) to indicate all groups.
- A name pattern containing one or more asterisks (*) that may match multiple groups.
- To filter the display to show only UNGROUPED CICS regions, simply omit the GROUP parameter entirely (leave it blank).
The APPLID may be one of the following:
- The application ID of the CICS region
- A single asterisk (*) to indicate all CICS regions.
- A name pattern containing one or more asterisks (*) that may match multiple CICS regions.
-
lpar=LPAR
Show CICS regions on the specified LPAR. You can use the lpar filter as a single statement, or you can append it to the end of an id filter using an ampersand (&).
The following examples demonstrate how to use the filter:
-
To display a CICS region named CICSDEV1 in a group named DEV1, enter the following:
id=DEV1:CICSDEV1
-
To show all CICS regions in a group named PROD:
id=PROD:*
-
To show all CICS regions in a group named PROD that begin with SYS:
id=PROD:SYS*
-
To display all CICS region named CICSDEV1 in any group, enter the following:
id=*:CICSDEV1
-
To show all the ungrouped CICS regions:
id=:*
-
To show the CICS regions in LPAR SYS1 enter the following:
lpar=SYS1
-
To show a CICS region named CICSTEST in group TEST on LPAR SYS1, use the following:
id=TEST:CICSTEST&lpar=SYS1
To reset the display, simply remove your search criteria from the filter box.
Actions available from Regions overview
You can perform the following actions from Regions overview:
- Record the CICS internal trace for transaction profiling by clicking the record button (
 ). For more information, see Recording CICS transactions.
 - Conduct detailed analysis of transactions recorded by C\Prof by clicking the zoom button (
 ). For more information, see Analyzing recorded transactions.
 - Take a snap of the CICS internal trace to an auxiliary trace data set by clicking the snap button (
 ). For more information, see Taking a snap of the CICS internal trace.