 scale(1 -1)' gradientUnits='userSpaceOnUse'%3e%3cstop offset='0' stop-color='%23d257fc' /%3e%3cstop offset='.15' stop-color='%23b62dcc' /%3e%3cstop offset='.32' stop-color='%23909' /%3e%3cstop offset='.44' stop-color='%238312b6' /%3e%3cstop offset='.76' stop-color='%23503eff' /%3e%3c/linearGradient%3e%3c/defs%3e%3cg%3e%3cg%3e%3cpath fill='%23fff' d='M288.22,77.61c2.7-1.09,5.19-2.4,7.44-3.91,3.22-2.16,5.96-4.72,8.15-7.59,2.2-2.88,3.9-6.12,5.07-9.65,1.16-3.52,1.75-7.29,1.75-11.23,0-4.95-.86-9.56-2.57-13.71-1.73-4.21-4.49-7.87-8.18-10.88-3.65-2.97-8.36-5.31-14-6.94-5.57-1.61-12.32-2.43-20.06-2.43h-35.88V126.51h24.51v-43.55h6.98c2.15,0,3.24,.34,3.77,.62,.77,.41,1.51,1.16,2.21,2.23l23.43,35.68c1.03,1.58,2.33,2.83,3.84,3.69,1.54,.88,3.4,1.33,5.52,1.33h22.21l-29.9-44.11c-1.27-1.85-2.7-3.45-4.28-4.78Zm-33.77-46.52h11.37c7.17,0,12.52,1.39,15.88,4.12,3.29,2.68,4.89,6.46,4.89,11.56,0,2.58-.42,4.97-1.26,7.1-.81,2.08-2.07,3.91-3.72,5.42-1.67,1.53-3.86,2.76-6.49,3.65-2.69,.91-5.93,1.37-9.61,1.37h-11.06V31.09Z' /%3e%3cpath fill='%23fff' d='M386.19,53.94c-3.56-3.67-7.92-6.54-12.95-8.53-5.01-1.98-10.65-2.98-16.76-2.98s-11.77,1-16.8,2.98c-5.06,1.99-9.44,4.86-13.03,8.53-3.59,3.67-6.4,8.19-8.36,13.45-1.95,5.22-2.93,11.12-2.93,17.54s.99,12.39,2.93,17.61c1.96,5.26,4.77,9.81,8.35,13.52,3.59,3.73,7.98,6.63,13.04,8.62,5.03,1.98,10.68,2.98,16.8,2.98s11.76-1,16.76-2.98c5.04-1.99,9.4-4.89,12.96-8.62,3.56-3.72,6.34-8.27,8.27-13.53,1.92-5.22,2.89-11.14,2.89-17.61s-.97-12.31-2.89-17.53c-1.93-5.26-4.72-9.79-8.28-13.46Zm-16.65,49.47c-2.81,3.93-7.08,5.84-13.07,5.84s-10.43-1.92-13.27-5.88c-2.94-4.1-4.43-10.25-4.43-18.29s1.49-14.22,4.43-18.37c2.84-4,7.17-5.95,13.26-5.95s10.26,1.93,13.07,5.91c2.91,4.12,4.39,10.32,4.39,18.41s-1.48,14.25-4.39,18.33Z' /%3e%3cpath fill='%23fff' d='M462.91,102.23c-1.61,0-3.07,.51-4.36,1.52-.94,.74-2.04,1.54-3.27,2.41-1.16,.81-2.62,1.57-4.36,2.26-1.64,.65-3.89,.98-6.66,.98s-5.21-.52-7.36-1.55c-2.13-1.02-3.97-2.54-5.48-4.52-1.54-2.03-2.75-4.6-3.58-7.64-.85-3.11-1.28-6.73-1.28-10.75s.39-7.4,1.17-10.44c.76-2.96,1.91-5.5,3.43-7.56,1.47-2,3.35-3.55,5.58-4.62,2.25-1.08,4.93-1.63,7.97-1.63,2.4,0,4.42,.27,5.99,.79,1.64,.55,3.07,1.17,4.24,1.85,1.26,.73,2.35,1.39,3.25,1.96,1.23,.78,2.53,1.18,3.87,1.18,1.45,0,2.62-.34,3.49-1,.67-.51,1.33-1.18,2-2.03l6-8.3-1.14-1.14c-3.7-3.7-7.93-6.58-12.58-8.57-4.66-1.99-10.14-3-16.27-3-6.44,0-12.25,1.09-17.24,3.24-5.01,2.15-9.28,5.18-12.69,8.99-3.39,3.8-6,8.35-7.74,13.53-1.73,5.13-2.6,10.76-2.6,16.75,0,6.67,.99,12.71,2.93,17.96,1.95,5.27,4.65,9.8,8.01,13.45,3.38,3.68,7.4,6.52,11.95,8.44,4.53,1.91,9.42,2.88,14.53,2.88,2.85,0,5.77-.21,8.67-.64,2.95-.43,5.85-1.18,8.6-2.22,2.77-1.05,5.48-2.47,8.06-4.21,2.59-1.75,5.03-3.96,7.24-6.54l1.01-1.18-6.38-8.09c-1.12-1.67-2.85-2.55-5-2.55Z' /%3e%3cpath fill='%23fff' d='M529.12,81.74c-.39-.49-.81-.96-1.26-1.4,.43-.35,.85-.73,1.25-1.12,.97-.94,1.92-1.99,2.83-3.11l27.18-32.46h-21.46c-1.93,0-3.56,.39-4.83,1.16-1.15,.69-2.23,1.64-3.26,2.85l-19.63,24.25c-.81,.97-1.38,1.37-1.71,1.53-.25,.13-.87,.34-2.16,.34h-1.66V8.2h-22.81V126.51h22.81v-36.23h2.43c1.65,0,2.38,.23,2.67,.36,.25,.12,.78,.48,1.55,1.65l20.11,29.98c1,1.51,2.18,2.6,3.5,3.26,1.29,.64,2.84,.97,4.62,.97h20.77l-28.4-41.35c-.84-1.21-1.69-2.35-2.54-3.41Z' /%3e%3cpath fill='%23fff' d='M625.48,88.87c.94-.38,1.69-1.03,2.24-1.91,.48-.77,.79-1.75,.96-2.98,.14-1.04,.21-2.33,.21-3.84,0-5.91-.9-11.26-2.67-15.89-1.78-4.67-4.31-8.68-7.51-11.91-3.21-3.24-7.08-5.73-11.5-7.41-4.39-1.67-9.24-2.51-14.43-2.51-6.14,0-11.75,1.09-16.67,3.24-4.92,2.15-9.15,5.11-12.57,8.81-3.42,3.69-6.08,8.07-7.9,13.04-1.82,4.94-2.74,10.28-2.74,15.87,0,7.14,1.05,13.52,3.13,18.98,2.09,5.49,5,10.17,8.66,13.91,3.67,3.75,8.04,6.62,13,8.53,4.92,1.9,10.31,2.86,16.02,2.86,2.85,0,5.83-.21,8.85-.63,3.07-.43,6.12-1.17,9.07-2.21,2.98-1.05,5.87-2.46,8.6-4.2,2.76-1.76,5.29-3.97,7.51-6.57l1.01-1.19-6.47-8.09c-.58-.79-1.28-1.41-2.09-1.85-.84-.46-1.82-.69-2.91-.69-1.51,0-3.05,.45-4.6,1.33-1.23,.7-2.68,1.49-4.33,2.35-1.57,.82-3.44,1.58-5.56,2.27-2.03,.66-4.52,.99-7.4,.99-5.8,0-10.31-1.68-13.77-5.15-3.14-3.14-5.1-8.07-5.82-14.66h46.8c1.13,0,2.07-.16,2.87-.49Zm-49.09-14.77c.94-4.29,2.65-7.68,5.08-10.11,2.79-2.79,6.62-4.15,11.69-4.15,2.54,0,4.77,.42,6.62,1.26,1.84,.83,3.38,1.97,4.58,3.39,1.21,1.44,2.13,3.15,2.72,5.08,.44,1.43,.72,2.95,.85,4.54h-31.54Z' /%3e%3cpath fill='%23fff' d='M681.7,108.6l-.08-.12c-.52-.71-1.01-1.25-1.52-1.65-1.27-.99-3.22-1.16-4.92-.12-.43,.26-.92,.54-1.47,.82-.51,.27-1.13,.53-1.84,.78-.59,.21-1.37,.31-2.34,.31-1.53,0-2.65-.46-3.52-1.45-.91-1.03-1.37-2.55-1.37-4.53V61.69h20.81v-17.34h-20.81V19.45h-11.75c-1.55,0-2.88,.41-3.95,1.23-1.12,.85-1.84,2.04-2.14,3.55l-3.77,20.28-12.99,2.13v9.16c0,1.89,.59,3.37,1.75,4.41,1.1,.98,2.41,1.48,3.92,1.48h6.13v42.28c0,7.3,2.04,13.15,6.07,17.37,4.05,4.25,9.83,6.4,17.17,6.4,4.04,0,8-.63,11.77-1.87,3.81-1.25,7.23-3.13,10.18-5.58l1.26-1.05-6.56-10.64Z' /%3e%3c/g%3e%3cg%3e%3cpath fill='%23fff' d='M255.78,168.38c-.2,.4-.51,.6-.94,.6-.31,0-.72-.18-1.21-.53-.5-.35-1.15-.75-1.96-1.19-.81-.44-1.8-.84-2.98-1.19-1.18-.35-2.62-.53-4.32-.53-1.53,0-2.93,.22-4.19,.66-1.26,.44-2.34,1.03-3.24,1.76-.89,.74-1.59,1.59-2.09,2.57-.5,.98-.75,2-.75,3.08,0,1.33,.34,2.43,1.02,3.31,.68,.88,1.57,1.63,2.68,2.25,1.11,.62,2.36,1.16,3.77,1.61,1.4,.45,2.85,.91,4.32,1.36,1.48,.45,2.92,.96,4.32,1.51,1.4,.55,2.66,1.24,3.77,2.07,1.11,.82,2,1.83,2.68,3.02,.68,1.19,1.02,2.64,1.02,4.34,0,1.85-.33,3.56-1,5.15-.67,1.59-1.63,2.97-2.9,4.13-1.26,1.16-2.82,2.09-4.66,2.77-1.85,.68-3.95,1.02-6.3,1.02-2.98,0-5.55-.48-7.71-1.43-2.16-.95-4.09-2.19-5.79-3.73l.98-1.45c.14-.23,.3-.4,.47-.51,.17-.11,.41-.17,.72-.17,.37,0,.82,.23,1.36,.68s1.24,.94,2.11,1.47c.87,.53,1.94,1.02,3.24,1.47s2.89,.68,4.79,.68c1.79,0,3.36-.25,4.73-.75,1.36-.5,2.5-1.17,3.41-2.02s1.6-1.85,2.07-3,.7-2.36,.7-3.64c0-1.42-.34-2.6-1.02-3.53-.68-.94-1.58-1.73-2.68-2.38-1.11-.65-2.36-1.21-3.77-1.66-1.41-.45-2.85-.91-4.34-1.36s-2.94-.95-4.34-1.49c-1.4-.54-2.66-1.22-3.77-2.04-1.11-.82-2-1.82-2.68-3-.68-1.18-1.02-2.65-1.02-4.41,0-1.5,.33-2.95,.98-4.34,.65-1.39,1.58-2.61,2.79-3.66,1.21-1.05,2.68-1.89,4.41-2.51,1.73-.62,3.68-.94,5.83-.94,2.58,0,4.88,.37,6.88,1.12,2,.75,3.84,1.89,5.51,3.43l-.89,1.41Z' /%3e%3cpath fill='%23fff' d='M306.06,162.42c3.04,0,5.76,.52,8.15,1.55,2.4,1.04,4.42,2.51,6.07,4.41,1.65,1.9,2.9,4.19,3.77,6.88,.87,2.68,1.3,5.68,1.3,9.01s-.43,6.32-1.3,8.98c-.87,2.67-2.12,4.95-3.77,6.86-1.65,1.9-3.67,3.36-6.07,4.39-2.4,1.02-5.12,1.53-8.15,1.53s-5.76-.51-8.15-1.53c-2.4-1.02-4.43-2.48-6.09-4.39-1.66-1.9-2.92-4.19-3.79-6.86-.87-2.67-1.3-5.66-1.3-8.98s.43-6.32,1.3-9.01c.87-2.68,2.13-4.97,3.79-6.88,1.66-1.9,3.69-3.37,6.09-4.41,2.4-1.04,5.12-1.55,8.15-1.55Zm0,40.41c2.53,0,4.73-.43,6.62-1.3,1.89-.87,3.46-2.11,4.73-3.73,1.26-1.62,2.21-3.57,2.83-5.85,.62-2.29,.94-4.85,.94-7.69s-.31-5.37-.94-7.66c-.63-2.3-1.57-4.26-2.83-5.9-1.26-1.63-2.84-2.89-4.73-3.77-1.89-.88-4.1-1.32-6.62-1.32s-4.73,.44-6.62,1.32c-1.89,.88-3.46,2.14-4.73,3.77-1.26,1.63-2.21,3.6-2.85,5.9-.64,2.3-.96,4.85-.96,7.66s.32,5.4,.96,7.69c.64,2.29,1.59,4.24,2.85,5.85,1.26,1.62,2.84,2.86,4.73,3.73,1.89,.87,4.09,1.3,6.62,1.3Z' /%3e%3cpath fill='%23fff' d='M358.95,205.47v-37.94l-5.96-.38c-.82-.06-1.23-.41-1.23-1.06v-1.66h7.2v-5.36c0-2.41,.31-4.54,.94-6.37,.62-1.83,1.5-3.36,2.64-4.58,1.13-1.22,2.5-2.14,4.11-2.75,1.6-.61,3.37-.92,5.3-.92,.88,0,1.77,.08,2.66,.23,.89,.16,1.68,.38,2.36,.66l-.13,1.96c-.03,.4-.3,.6-.81,.6-.34,0-.8-.04-1.38-.13s-1.3-.13-2.15-.13c-1.39,0-2.68,.21-3.85,.62-1.18,.41-2.19,1.07-3.04,1.98s-1.51,2.09-1.98,3.56c-.47,1.46-.7,3.26-.7,5.39v5.24h13.75v3.02h-13.67v38.02h-4.05Z' /%3e%3cpath fill='%23fff' d='M419.75,206.15c-2.87,0-5.1-.79-6.68-2.38-1.59-1.59-2.38-4.04-2.38-7.37v-28.95h-6.09c-.31,0-.57-.09-.77-.26s-.3-.41-.3-.72v-1.58l7.24-.51,1.01-15.16c.03-.25,.13-.48,.32-.68,.18-.2,.43-.3,.74-.3h1.89v16.18h13.33v3.02h-13.33v28.74c0,1.16,.15,2.17,.45,3,.3,.84,.71,1.53,1.23,2.07,.52,.54,1.14,.94,1.85,1.19,.71,.26,1.48,.38,2.3,.38,1.02,0,1.9-.15,2.64-.45,.74-.3,1.38-.62,1.92-.98,.54-.35,.98-.68,1.32-.98,.34-.3,.61-.45,.81-.45,.23,0,.45,.14,.68,.43l1.11,1.79c-1.08,1.19-2.45,2.15-4.11,2.87-1.66,.72-3.38,1.09-5.17,1.09Z' /%3e%3cpath fill='%23fff' d='M453.22,163.1h3.11c.4,0,.72,.11,.98,.32,.26,.21,.43,.45,.51,.7l10.69,33.43c.2,.65,.35,1.28,.47,1.87,.11,.6,.23,1.19,.34,1.79,.14-.6,.3-1.19,.47-1.79,.17-.6,.37-1.22,.6-1.87l11.37-33.72c.2-.62,.6-.94,1.19-.94h1.66c.62,0,1.04,.31,1.23,.94l11.2,33.72c.43,1.28,.77,2.51,1.02,3.7,.11-.6,.23-1.2,.36-1.81,.13-.61,.31-1.24,.53-1.89l10.73-33.43c.23-.68,.71-1.02,1.45-1.02h2.98l-14.18,42.37h-2.98c-.45,0-.78-.3-.98-.89l-11.63-34.4c-.14-.43-.27-.85-.38-1.28-.11-.43-.21-.85-.3-1.28-.09,.43-.18,.85-.28,1.28-.1,.43-.22,.85-.36,1.28l-11.75,34.4c-.17,.6-.51,.89-1.02,.89h-2.85l-14.18-42.37Z' /%3e%3cpath fill='%23fff' d='M568.48,205.47c-.85,0-1.38-.4-1.58-1.19l-.6-5.41c-1.16,1.13-2.32,2.16-3.47,3.07-1.15,.91-2.35,1.67-3.6,2.3-1.25,.62-2.6,1.1-4.05,1.43-1.45,.33-3.04,.49-4.77,.49-1.45,0-2.85-.21-4.22-.64-1.36-.43-2.57-1.08-3.62-1.96-1.05-.88-1.89-2.01-2.53-3.39-.64-1.38-.96-3.03-.96-4.96,0-1.79,.51-3.45,1.53-4.98,1.02-1.53,2.62-2.87,4.79-4,2.17-1.14,4.97-2.04,8.39-2.73,3.42-.68,7.53-1.08,12.33-1.19v-4.43c0-3.92-.84-6.93-2.53-9.05-1.69-2.11-4.19-3.17-7.52-3.17-2.04,0-3.78,.28-5.22,.85-1.43,.57-2.65,1.19-3.64,1.87-.99,.68-1.8,1.31-2.43,1.87-.62,.57-1.15,.85-1.58,.85-.57,0-.99-.25-1.28-.77l-.72-1.23c2.21-2.21,4.54-3.89,6.98-5.02,2.44-1.14,5.21-1.7,8.3-1.7,2.27,0,4.26,.36,5.96,1.09s3.11,1.76,4.24,3.11c1.12,1.35,1.97,2.98,2.53,4.9,.57,1.92,.85,4.05,.85,6.41v27.59h-1.62Zm-17.03-2.26c1.65,0,3.16-.18,4.54-.53,1.38-.35,2.65-.85,3.83-1.49s2.28-1.4,3.3-2.28c1.02-.88,2.03-1.83,3.02-2.85v-11.03c-4.03,.11-7.5,.42-10.41,.92s-5.31,1.17-7.2,2.02-3.28,1.87-4.17,3.04c-.89,1.18-1.34,2.52-1.34,4.02,0,1.42,.23,2.65,.7,3.68,.47,1.04,1.09,1.89,1.85,2.55,.77,.67,1.66,1.16,2.68,1.47,1.02,.31,2.09,.47,3.19,.47Z' /%3e%3cpath fill='%23fff' d='M603.74,205.47v-42.37h2.13c.48,0,.83,.1,1.04,.3,.21,.2,.33,.54,.36,1.02l.34,8.94c1.36-3.43,3.18-6.12,5.45-8.07,2.27-1.94,5.07-2.92,8.39-2.92,1.28,0,2.45,.13,3.53,.4s2.1,.66,3.07,1.17l-.55,2.81c-.09,.45-.37,.68-.85,.68-.17,0-.41-.06-.72-.17-.31-.11-.7-.24-1.17-.38s-1.04-.27-1.72-.38c-.68-.11-1.46-.17-2.34-.17-3.21,0-5.84,.99-7.9,2.98-2.06,1.99-3.73,4.85-5,8.6v27.55h-4.04Z' /%3e%3cpath fill='%23fff' d='M668.25,162.42c2.38,0,4.59,.41,6.62,1.23s3.79,2.02,5.28,3.6c1.49,1.57,2.65,3.51,3.49,5.81,.84,2.3,1.26,4.94,1.26,7.92,0,.63-.09,1.05-.28,1.28s-.47,.34-.87,.34h-30.57v.81c0,3.18,.37,5.98,1.11,8.39,.74,2.41,1.79,4.44,3.15,6.07,1.36,1.63,3.01,2.86,4.94,3.68,1.93,.82,4.09,1.23,6.47,1.23,2.13,0,3.97-.23,5.54-.7s2.87-.99,3.94-1.57c1.06-.58,1.91-1.11,2.53-1.58s1.08-.7,1.36-.7c.37,0,.65,.14,.85,.43l1.11,1.36c-.68,.85-1.58,1.65-2.7,2.38-1.12,.74-2.37,1.37-3.75,1.89s-2.85,.94-4.43,1.26c-1.58,.31-3.16,.47-4.75,.47-2.9,0-5.54-.5-7.92-1.51s-4.43-2.48-6.14-4.41c-1.71-1.93-3.03-4.29-3.96-7.09-.93-2.8-1.4-6-1.4-9.6,0-3.04,.43-5.84,1.3-8.41,.87-2.57,2.11-4.78,3.75-6.64,1.63-1.86,3.63-3.31,6-4.36,2.37-1.05,5.06-1.58,8.07-1.58Zm.06,3.02c-2.18,0-4.14,.34-5.87,1.02-1.73,.68-3.22,1.66-4.49,2.94-1.26,1.28-2.28,2.81-3.06,4.6-.78,1.79-1.3,3.79-1.55,6h27.89c0-2.27-.31-4.31-.93-6.11-.62-1.8-1.5-3.33-2.64-4.58s-2.49-2.21-4.08-2.87c-1.59-.67-3.34-1-5.27-1Z' /%3e%3c/g%3e%3cpath fill='url(%23BLAST)' fill-rule='evenodd' d='M4.12,92.96c-1.43-.39-2.64-1.32-3.38-2.6-.74-1.28-.93-2.8-.55-4.23,.39-1.43,1.32-2.64,2.6-3.38,1.28-.74,2.8-.93,4.23-.55l50.57,13.55h0c3.17,.87,6.52,.91,9.71,.08l.28-.07c3.05-.91,5.82-2.58,8.05-4.86l.02,.02L156.93,9.65c1.05-1.05,2.46-1.63,3.94-1.63s2.9,.59,3.94,1.63c1.05,1.05,1.63,2.46,1.63,3.94s-.59,2.9-1.63,3.94L83.55,98.8v.02c-3.58,3.64-8.06,6.28-12.98,7.69-.13,.04-.25,.08-.38,.12-5.07,1.34-10.4,1.31-15.46-.09h0S4.12,92.96,4.12,92.96Zm18.81-18.77l25.88,6.93c5.06,1.41,10.4,1.43,15.47,.08,5.07-1.36,9.69-4.05,13.37-7.79l33.19-33.19c1.05-1.05,1.64-2.48,1.64-3.96s-.59-2.91-1.64-3.96-2.48-1.64-3.96-1.64-2.91,.59-3.96,1.64l-33.19,33.19c-2.47,2.47-5.32,4.13-8.36,4.95-3.04,.81-6.33,.8-9.69-.1l-25.87-6.93c-.71-.2-1.46-.26-2.2-.17-.74,.09-1.45,.32-2.09,.69-.65,.37-1.21,.86-1.66,1.45-.45,.59-.79,1.26-.98,1.98-.19,.72-.24,1.47-.14,2.2,.1,.74,.35,1.44,.73,2.08,.38,.64,.88,1.2,1.47,1.64,.6,.44,1.27,.76,1.99,.94Zm101.03,124.93l-13.55-50.57c-.88-3.17-.92-6.52-.09-9.7l.07-.29c.9-3.05,2.57-5.83,4.84-8.06L196.5,49.22c1.05-1.05,1.63-2.46,1.63-3.94s-.59-2.9-1.63-3.94c-1.05-1.05-2.46-1.63-3.94-1.63-1.48,0-2.9,.59-3.94,1.63L107.36,122.6c-3.65,3.59-6.3,8.06-7.71,12.97-.04,.13-.08,.25-.12,.38-1.34,5.07-1.31,10.4,.09,15.46h.01l13.56,50.61c.39,1.43,1.32,2.64,2.6,3.38,1.28,.74,2.8,.93,4.23,.55,1.43-.39,2.64-1.32,3.38-2.6,.74-1.28,.93-2.8,.55-4.23h0Zm18.79-18.79l-6.93-25.86c-.88-3.17-.92-6.52-.09-9.71l.07-.28c.91-3.05,2.58-5.82,4.86-8.05l33.2-33.19c1.05-1.05,1.64-2.48,1.64-3.96s-.59-2.91-1.64-3.96c-1.05-1.05-2.48-1.64-3.96-1.64s-2.91,.59-3.96,1.64l-33.18,33.2c-3.64,3.6-6.29,8.07-7.69,12.99-.04,.12-.08,.25-.12,.38-1.34,5.07-1.31,10.4,.09,15.46h.01l6.94,25.9c.19,.71,.52,1.37,.97,1.95,.45,.58,1,1.07,1.64,1.43,.63,.37,1.34,.6,2.06,.7,.73,.09,1.46,.04,2.17-.15,.71-.19,1.37-.52,1.95-.97s1.07-1,1.43-1.64c.36-.63,.6-1.34,.69-2.06,.09-.73,.04-1.46-.15-2.17h0ZM185.84,12.4L16.74,181.48c-1.05,1.05-1.64,2.48-1.64,3.96s.59,2.91,1.64,3.96c1.05,1.05,2.48,1.64,3.96,1.64s2.91-.59,3.96-1.64L193.75,20.31c1.03-1.05,1.6-2.47,1.59-3.94-.01-1.47-.6-2.88-1.64-3.92-1.04-1.04-2.45-1.63-3.92-1.64-1.47-.01-2.89,.56-3.94,1.59ZM51.18,115.37L15.8,150.75c-1.05,1.05-1.64,2.48-1.64,3.96,0,1.49,.59,2.91,1.64,3.96,1.05,1.05,2.48,1.64,3.96,1.64,1.49,0,2.91-.59,3.96-1.64l35.37-35.38c.52-.52,.93-1.14,1.22-1.82,.28-.68,.43-1.41,.43-2.14s-.14-1.47-.43-2.15c-.28-.68-.69-1.3-1.22-1.82-.52-.52-1.14-.93-1.82-1.22-.68-.28-1.41-.43-2.15-.43s-1.47,.15-2.15,.43c-.68,.28-1.3,.7-1.82,1.22v.02Zm31.7,31.68l-35.38,35.39c-1.05,1.05-1.64,2.48-1.64,3.96,0,1.49,.59,2.91,1.64,3.96,1.05,1.05,2.48,1.64,3.96,1.64,1.49,0,2.91-.59,3.96-1.64l35.37-35.39c1.03-1.06,1.6-2.47,1.59-3.94-.01-1.47-.6-2.88-1.64-3.92s-2.45-1.63-3.92-1.64c-1.47,0-2.89,.56-3.94,1.59Z' /%3e%3c/g%3e%3cpath fill='%23fff' d='M679.92,14.02c0-1.29,.17-2.53,.5-3.73,.33-1.19,.8-2.31,1.41-3.35,.61-1.04,1.34-1.98,2.19-2.83,.85-.85,1.8-1.58,2.84-2.19,1.03-.61,2.15-1.08,3.33-1.42,1.19-.33,2.43-.5,3.72-.5s2.53,.17,3.73,.5c1.19,.33,2.31,.8,3.34,1.42,1.04,.61,1.98,1.34,2.84,2.19s1.59,1.79,2.19,2.83c.61,1.04,1.08,2.16,1.41,3.35,.33,1.19,.5,2.44,.5,3.73s-.17,2.51-.5,3.71c-.33,1.19-.8,2.31-1.41,3.34-.61,1.03-1.34,1.98-2.19,2.83-.86,.85-1.8,1.58-2.84,2.19-1.03,.61-2.15,1.09-3.34,1.42-1.2,.33-2.44,.5-3.73,.5s-2.53-.17-3.72-.5c-1.19-.33-2.3-.8-3.33-1.42-1.04-.61-1.98-1.34-2.84-2.19-.86-.85-1.59-1.79-2.19-2.83-.61-1.03-1.08-2.14-1.41-3.33-.33-1.19-.5-2.43-.5-3.72Zm1.92,0c0,1.14,.14,2.23,.42,3.28,.28,1.05,.68,2.03,1.21,2.94,.52,.91,1.15,1.74,1.88,2.48,.73,.74,1.54,1.38,2.43,1.91s1.86,.94,2.89,1.23c1.04,.29,2.11,.43,3.24,.43,1.69,0,3.27-.32,4.74-.96s2.76-1.51,3.85-2.61c1.09-1.1,1.96-2.4,2.59-3.89,.63-1.49,.95-3.09,.95-4.8,0-1.14-.14-2.23-.43-3.29-.29-1.06-.69-2.05-1.22-2.96s-1.15-1.75-1.89-2.5c-.73-.75-1.55-1.39-2.44-1.92-.89-.53-1.86-.94-2.9-1.24-1.04-.29-2.12-.44-3.25-.44-1.69,0-3.26,.32-4.73,.97-1.47,.65-2.75,1.53-3.83,2.64-1.09,1.12-1.94,2.43-2.57,3.93s-.94,3.11-.94,4.82Zm9.31,1.72v6.78h-2.99V5.44h5.52c2.2,0,3.83,.4,4.89,1.2s1.59,1.97,1.59,3.53c0,1.2-.34,2.22-1.03,3.06s-1.7,1.42-3.06,1.74c.22,.13,.41,.29,.57,.48s.31,.42,.45,.67l4.37,6.4h-2.84c-.42,0-.73-.16-.94-.48l-3.85-5.78c-.11-.17-.25-.29-.41-.38-.16-.09-.41-.13-.74-.13h-1.53Zm0-2.18h2.22c.7,0,1.3-.07,1.79-.2,.49-.13,.89-.33,1.19-.58,.3-.26,.52-.57,.65-.94,.13-.37,.2-.8,.2-1.28s-.06-.89-.18-1.25c-.12-.36-.32-.65-.59-.88s-.64-.4-1.08-.52c-.45-.11-1-.17-1.67-.17h-2.53v5.82Z' /%3e%3c/svg%3e)
Use the following procedure to get started.
Step 1: Start and configure the CICS internal trace
C\Prof gathers information on CICS activity from the CICS internal trace. To record transaction profiles, C\Prof requires you to place the CICS internal trace into the STARTED state, and to set a table size large enough to ensure that C\Prof can collect from the trace before the oldest entries are overwritten by new entries (a condition known as wrapping). To reduce the likelihood of wrapping, it is recommended that you set an initial value for the trace table size to 32 MB and only increase it incrementally as required.
To run C\Prof, you will need to start and configure the CICS internal trace in each CICS region that you wish to monitor. This can be done using any of the following methods:
-
Dynamically at any time using the CICS-supplied transaction CETR.
-
At CICS startup with system initialization parameters (SIT).
-
Allow C\Prof to control the trace using the C\Prof trace control program, TXCCICS1 together with the TRACECONTROL, ACTIVATETRACE, and RESETTRACE control statements.
These methods are described in the sections below.
CETR method
To temporarily configure the CICS internal trace using CETR:
-
Log onto your CICS region.
-
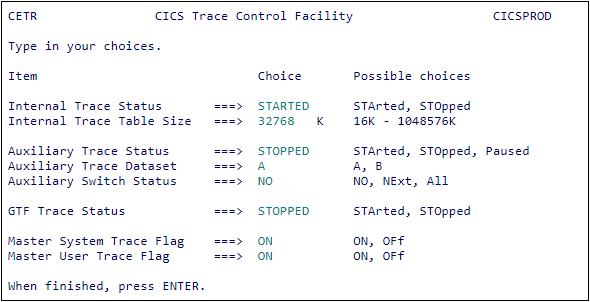
Start transaction CETR. The CICS Trace Control Facility is displayed.
-
CETR CICS Trace Control Facility
-
Set the Internal Trace Status to STARTED.
-
Set the Internal Trace Table Size to 32768 (32 MB) or higher.
-
Set the Master System Trace Flag to ON.
-
Press Enter to save your settings, and then press PF3 to quit.
SIT method
To configure the CICS internal trace at startup, add the following system initialization parameters to your CICS regions:
-
SYSTR=ONThe SYSTR system initialization parameter specifies the setting of the master system trace flag.
-
INTTR=ONThe INTTR system initialization parameter specifies whether the internal CICS trace destination is to be activated at system initialization.
-
TRTABSZ=32768The TRTABSZ system initialization parameter specifies the size, in kilobytes, of the internal trace table. Set it to a value of 32768 KB (32 MB) or higher.
TRACECONTROL method
You can optionally configure the collector to invoke the C\Prof trace control program TXCCICS1. TXCCICS1 can be used to adjust the status and size of the CICS internal trace automatically when collection starts and stops. This method can be useful if your normal internal trace settings are not compatible with the requirements of collection. This can occur, for example, if the internal trace must usually be in a STOPPED state, or if you require a trace table size during normal operations that is too small for C\Prof.
If you wish to use the C\Prof trace control program for a specific CICS region, it is recommended that you complete the remaining steps in this quick start guide before attempting to use trace control in that CICS region. When you have finished this setup procedure, refer to Configuring automatic internal trace control for specific CICS regions for more information on setting up the program and how to add the relevant control statements to your configuration file to enable the feature.
Step 2: Update product settings
Configure the C\Prof ISPF dialog by completing the following steps.
-
Start the C\Prof ISPF dialog.
To do this, use the new menu option you created in Create a C\Prof menu option.
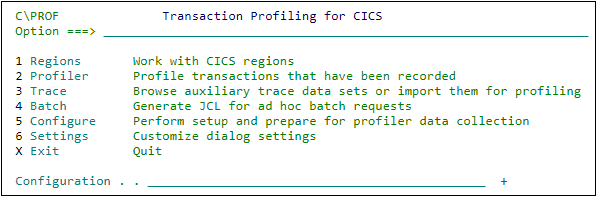
C\Prof primary option menu -
Select option 6 Settings.
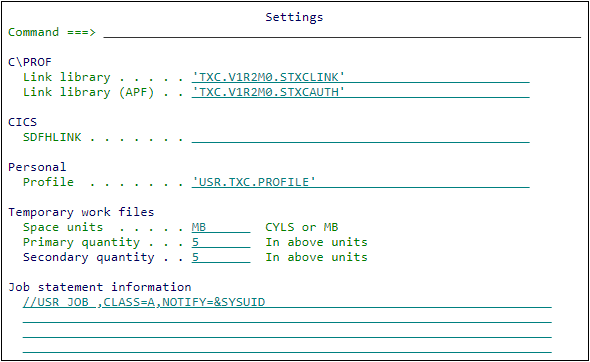
The Settings panel -
Review the following settings, replacing TXC.V1R2M0 with the high-level qualifier you selected during product installation:
-
C\PROF Link library
Specify the name of the C\Prof link library, TXC.V1R2M0.STXCLINK, in the space provided. The C\PROF link library contains the ISPF and batch executable modules.
-
C\PROF Link library (APF)
Specify the name of the C\Prof link library, TXC.V1R2M0.STXCAUTH, in the space provided. This APF authorized library is used as the STEPLIB in JCL generated for the following purposes:
-
Discovering CICS systems and generating a configuration file (as described in Step 4: Generate a configuration file)
-
Recording from the internal trace (as described in Step 8: Record transaction data)
-
-
CICS SDFHLINK
Leave this field empty if you have performed the optional CICS installation step Installing CICS-required modules in the MVS linklist in the IBM Knowledge Center as the modules are already available to all users and no further action is required. Otherwise, specify one of the following libraries:
-
The name of the CICS SDFHLINK library you created in CICS trace formatting routines. This library must contain modules DFHTRxxx and DFHTTxxx for each release of CICS you wish to support.
-
The actual CICS SDFHLINK library for the version of CICS that you wish to support. Using this option may limit you to supporting only one version of CICS at a time.
-
-
Personal Profile
The profile library is used by the ISPF dialog to permanently save certain session details, including the trace data set list. This data set is allocated for you and can be any name. You can share this library with other C\Prof users.
-
Temporary work files
Specify the size and units for temporary work files used by C\Prof.
C\Prof uses temporary work files to contain transaction lists and trace data associated with your active requests. Long lists may require additional work file space. Message TXC1043E is issued by the ISPF dialog when the space settings are too small. Select a starting value of 5 MB for both primary and secondary quantity field. Increase the size if your profiling requests fail.
-
Job statement information
Specify default job statement information. These job cards are used for all JCL that is generated by the ISPF dialog.
-
-
Press PF3 to exit.
Step 3: Allocate configuration and checkpoint data sets
The C\Prof collection server requires you to supply a configuration file and to register data sets created through the collection process in a checkpoint data set. In this step, we will use primary menu option 5 Configure to create the initial data set for the server configuration file and for a checkpoint data set.
-
On the C\Prof primary option menu, select option 5 Configure. The Configure the server panel is shown.
-
Enter a data set naming prefix in the +PREFIX field. C\Prof will use this prefix as a high-level qualifier for all data sets created during setup and for all data collected by the C\Prof collection server.
+PREFIX is a substitution variable. For example, when +PREFIX is specified as USER.CPROF and the data set name pattern is +PREFIX.CONFIG then the fully qualified data set name is USER.CPROF.CONFIG.
+PREFIX is optional. If you choose not to use it then the required data sets must specify their own name or pattern.
-
Review the name specified in the Configuration field and make changes as desired. The Configuration control data set is used to store the configuration file and JCL generated by the dialog.
-
Select option 1 Allocate the configuration and JCL library to allocate the data set.
-
Review the status message at the top-right of the screen to confirm that the allocation was successful.
-
In the LPAR field, enter the name of the LPAR where the CICS regions you wish to monitor are running. C\Prof inserts this value into JCL generated in subsequent steps.
Note: If you want to collect from additional LPARs, complete the setup procedure and then refer to the topic Expanding your collection topology to CICS regions in other LPARs for more information.
-
Review the checkpoint data set name specified in the Checkpoint field and make changes as desired.
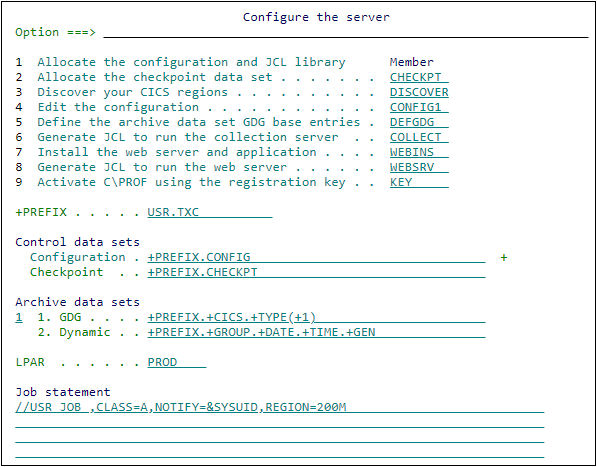
The Configure the server panel
The checkpoint data set is a VSAM KSDS used by C\Prof in the following ways:
- To register data sets created by the C\Prof collection server during the trace collection process.
- To locate collected data as requested in the C\Prof ISPF dialog.
- To manage the removal of data collected by the C\Prof collection server once the data has reached a specified expiration threshold using the housekeeping.
-
Select option 2 Allocate the checkpoint data set to generate JCL to allocate the checkpoint data set.
-
Submit the generated IDCAMS JCL.
Tips:
- All JCL generated by the dialog is stored in the data set specified in the Configuration field. You can use the Member column to specify alternative names to use when storing the corresponding JCL.
- After the configuration data set has been allocated, the Configuration field label becomes a point and shoot screen element that you can use to browse and edit the contents of the data set. Simply place your cursor on Configuration and press Enter.
- To view a list of members in the configuration data set, enter M on the Option line.
- The same checkpoint data set can be used by multiple collectors to provide a unified view of transaction data. Use this technique if you wish to collect data from multiple LPARs. Additional information can be found in Collecting from CICS regions that use multiregion operation (MRO).
Step 4: Generate a configuration file
In this step, we will use the discover utility to discover your running CICS regions and generate the collector configuration file required by the C\Prof collection server.
-
On the Configure the server panel, review the settings for archive data set naming.
Archive data sets are used by C\Prof to store data collected from the CICS internal trace. Archive data sets can be shared between users to provide universal access to trace data from a single C\Prof collection server, or they can be created by individuals for private use. The settings you choose in this step are used by C\Prof to determine the naming conventions used for these data sets.
There are two archive data set storage options: generation data groups (GDG) and Dynamic. Select option 1 to manage archive data sets using GDGs, or option 2 to allow C\Prof to allocate data sets on-demand using the dynamic option.
Consider the following tradeoffs when making your choice.
-
GDG base entries
GDG requires base entries before C\Prof can write data to the data set. This places an additional burden on administrators when you change your data set naming pattern, when new CICS regions are introduced, and when the name of your CICS region or group is changed as you will need to create new base entries each time they change. Dynamic has no such limitations.
If you select GDG, you will be prompted to create the GDG base entries later in this setup procedure.
-
Housekeeping
GDG provides an automatic high-water mark on the amount of archive data that resides on DASD at any one time. Using GDGs ensures that once the generation data set limit has been reached, the oldest data set is automatically deleted.
When using the dynamic option, new data set are allocated as required without regard for how much data has already been collected. This can potentially cause operational issues if left unmanaged. When using the dynamic option, consider using the C\Prof housekeeping utility (see Cleaning up old collection data via housekeeping) to periodically delete old data sets that have expired.
-
Limited number of data sets
GDG is limited to 255 generation data sets (999 with extended GDG support in z/OS 2.2).
Dynamic has no limit on the number of data sets that can be cataloged at any one time.
One you have selected your storage option, review the naming pattern supplied in the adjacent field. You can use the default naming pattern, or you can customize the naming pattern if you wish to use a different data set naming scheme.
To learn more data set naming and allocation in C\Prof, see ARCHDSN=pattern.
-
-
Select option 3 Discover your CICS regions to generate JCL for the discover utility.
-
Optional: If you want to collect data from CICSPlex SM address spaces (CMAS), uncomment the CMAS control statement by removing the preceding hashes (##).
-
Optional: The
WITHGROUPINGcontrol statement in the generated JCL instructs the discovery process to automatically group the CICS regions it finds. It does this by determining which CICS regions are connected via CONNECTION or IPCONN definitions. This is useful when defining a group of regions that use MRO. If you do not wish to group your regions in this way, simply remove theWITHGROUPINGstatement.To learn more about region grouping in C\Prof, see GROUP=name and GROUPEND.
-
Submit the generated JCL.
C\Prof locates your running CICS regions and generates the configuration file using the name supplied in the Member column. A list of discovered CICS regions can be found in the SYSPRINT output data set.
SYS1     TXC0001I C\\PROF is starting
CICSDEV1 TXC0382I CICS region was discovered: CICS TS V5.4 (710) Size=32768K
                  Wrap=38.35 seconds
CICSPRD2 TXC0382I CICS region was discovered: CICS TS V5.1 (680) Size=32768K
                  Wrap=41.81 seconds
...
Example of SYSPRINT output data set from CICS region discovery
Tip: If desired, all users can share the same configuration file and gain access to the same collected data. No additional user setup is required.
Step 5: Edit the configuration file
Before you run the collector, review the generated configuration file.
-
On the Configure the server panel, select option 4 Edit the configuration. The configuration file is displayed.
Tip: The data set and member name of the configuration file is displayed at the top of the screen for future reference.
-
Specify a z/OS UNIX domain socket name for the C\Prof collection server. The server uses this socket to listen for trace collection requests from the C\Prof ISPF dialog. To specify the socket name, complete the following steps:
- Find the
SOCKET=<zFS_file_name>control statement. - Replace
<zFS_file_name>with a file name in the z/OS UNIX file system (zFS) of your choice.
You do not need to create the file yourself. Simply supply the full name and path you wish to use in a writable location appropriate to your environment. The maximum length is 108 characters. Access to the C\Prof collection server is secured by file access to the specified zFS path name. Write access is required to connect to the socket.
Example: To assign zFS path /u/cicsprod/cprof.sock, specify
SOCKET=/u/cicsprod/cprof.sockin your configuration file.Note: C\Prof can still be used to collect data without a socket by using the alternative method of submitting ad hoc batch requests. It is strongly recommended that you use the SOCKET as it provides rich collection and trace status information in option 1 Regions on the C\Prof primary option menu and serves as a foundation for creating a cross-LPAR collection topology. If, however, your environment precludes you from using a socket, you can omit the SOCKET statement and continue with a limited set of functions. Some deviation with the screens displayed in this document can also be expected.
- Find the
-
Edit and group your CICS regions. To do this, complete the following steps:
-
Edit the CICS control statements.
Configuration files generated by C\Prof contain a list of all CICS regions that were running whilst the discovery process was taking place. These CICS regions are defined in the configuration file using CICS control statements.
To submit collection requests for a CICS region, it must be defined in the configuration file. If a CICS region was offline at the time of discovery, you can manually insert it now. If you do not want to allow collection on a specific CICS region, simply remove it from the configuration file.
-
Define multiregion operation (MRO) groups using the GROUP and MRO control statements.
If you have a set of CICS regions that use multiregion operation (MRO), define an MRO group in the configuration file. An MRO group is defined using the GROUP=name MRO=YES and GROUPEND statements.
Example: To define a group named SYS1 that contains an MRO group that includes a terminal-owning region (TOR), an application owning region (AOR), and a file owning region (FOR), use the following control statements:
GROUP=SYS1 MRO=YES
CICS=CICSTOR
CICS=CICSAOR
CICS=CICSFOR
GROUPEND
Grouping CICS regions for multiregion operation (MRO)
Note: For more information on how C\Prof treats MRO transactions, see Collecting from CICS regions that use multiregion operation (MRO).
-
Define operational groups.
The GROUP control statement can also be used to group sets of CICS regions for operational management purposes. This can be useful if you wish to submit a single collection request for a group of regions (for example, all of your test CICS regions) rather than submitting several individual requests for each group member. To do this, use the same syntax as in the step above, but set MRO=NO (or omit the MRO statement entirely).
Example: To define a group named TESTGRP that contains two independent CICS regions used for testing, use the following control statements:
GROUP=TESTGRP
CICS=CICSTST1
CICS=CICSTST2
GROUPEND
Grouping CICS regions for operational management
-
-
Optional: The following additional control statements have been automatically added to your configuration file. To learn more about the C\Prof configuration file, it is highly recommended that you take the time to review the information below. If a control statement is commented with double hashes (##), simply remove the hashes to enable the statement.
-
SERVERSets the collection mode to SERVER. C\Prof will start as a collection server and then wait for its first user-initiated collection request. This statement is required.
-
SERVICE=<class>To operate effectively, the collector must be able to quickly process the CICS internal trace. To ensure that the collector can perform this function, it is recommended that the collector have the same or higher Workload Manager (WLM) service class or dispatching priority as CICS. This is particularly important when running the collector in an environment where transaction volume and CPU utilization is high. You can use the optional SERVICE control statement in the configuration file to instruct C\Prof to set its required service class. To do this, replace with the service class of your choice. For more information, see SERVICE=service-class-name. The collector uses only a small amount of CPU and is often in a wait state so its impact on the system is low.
-
XCFGROUP=<name>The XCFGROUP control statement is an advanced option used to enable cross-collector communication, useful for establishing an expanded collection topology of multiple C\Prof collection servers that may span multiple LPARs. For now, do not adjust the XFGROUP control statement. When you have completed all the steps contained in the quick start procedure, refer to the information supplied in Expanding your collection topology to CICS regions in other LPARs for more on extending your collection topology.
-
PREFIX=<value>The +PREFIX control statement allows you to define a reusable naming prefix for data sets created by C\Prof. Replace the value with a prefix of your choice. The prefix will be prepended to the values you specify on the CHECKPT and ARCHDSN control statements described below.
-
CHECKPT=<data-set-name>The CHECKPT control statement is used to specify the name of the checkpoint data set. The value of the CHECKPT statement reflects the name you chose in Step 3: Allocate configuration and checkpoint data sets. This statement is required. More information on the CHECKPT control statement can be found in CHECKPT.
-
ARCHDSN=<pattern>The ARCHDSN control statement is used to specify the naming conventions used to store collected trace data. The settings applied in your configuration file have been derived from the choices you made in Step 4: Generate a configuration file. This statement is required. Rules that govern the naming of data sets can be found in ARCHDSN=pattern.
-
SUMMARY,DETAIL, andAUXILIARYThese control statements specify the allocation attributes for the three types of data sets that can be created by the C\Prof collection server (summary, detail, and auxiliary trace data sets). If you are unsure what allocation attributes may be required at your site, talk to your systems administrator for further guidance. You can adjust the allocation attributes for these data sets as desired using the information supplied in AUXTRSW.
-
LEVEL=2The LEVEL control statement controls how much detail is collected when recording for transaction profiling. For standard profiling, use LEVEL=2 to collect summary information and important trace events. For other options, see LEVEL=value.
-
ACTIVATETRACE=1andRESETTRACE=1ACTIVATETRACE=1 or higher grants C\Prof permission to adjust the active CICS trace levels for optimized profiling of transactions. RESETTRACE=1 restores your trace point levels to the state they were in before recording began. These are the recommended settings for profiling as they supply a complete application view of the trace.
Note: Changing the CICS trace levels can impact the CICS region and increase transaction CPU and response time. If you do not want C\Prof to temporarily adjust your trace points during collection, review the settings in ACTIVATETRACE for additional options. Note however that changing these options can limit C\Prof's ability to provide a complete application perspective of the trace.
-
TRACECONTROL=<options>If your CICS environment prevents you from permanently running the CICS internal trace in the STARTED state, you can use the TRACECONTROL control statement with the ACTIVATETRACE, and RESETTRACE control statements to automatically set the required status and size of the CICS internal trace when collection starts and stops. For more information, see Configuring automatic internal trace control for specific CICS regions. Otherwise, leave this setting unchanged.
-
- Save the file and then press PF3 to exit.
Note: The C\Prof configuration file has a variety of additional options to tailor collection to your environment. For a complete set of options, see Control statement summary.
Step 6: Define archive data set GDG base entries (GDG only)
If you have selected dynamic data set allocation instead of GDG (see Step 4: Generate a configuration file), you do not need to perform this step. Instead, proceed directly to Step 7: Start the C\Prof collection server.
If you have selected the GDG data set naming option, you will need to define the archive data set GDG base entries before you can start the collector by completing the following steps:
-
On the Configure the server panel, select option 5 Define the archive data set GDG base entries.
Note: The C\Prof ISPF dialog uses your configuration file to determine which base entries it needs to create. If your configuration file has a syntax error, you will be prompted to correct it before proceeding.
-
Optional: Review the JCL. By default, the GDG limit is set to 5 (LIM=005). If you need to retain more data you can increase the value to a maximum of 999 as necessary.
-
Submit the generated JCL.
Step 7: Start the C\Prof collection server
Generate C\Prof collection server JCL from the ISPF dialog.
-
On the Configure the server panel, select option 6 Generate JCL to run the collection server.
-
Submit the generated JCL. Note the data set and member name at the top of your screen. You can use this to run your collector at any time without having to re-generate the JCL. More information on collector JCL can be found in JCL.
-
Review the collector SYSPRINT output data set to verify that C\Prof has started.
SYS1     TXC0001I C\Prof is starting
         TXC0400I Configuration processing was successful; DD=SYSIN
USR#SYS1 TXC0501I Operator commands can now be issued
...
Example collector SYSPRINT data set: collection server startup sequence
The C\Prof collection server is now ready to accept collection requests.
Note: Message codes and associated descriptions can be found in Messages and Codes.
Step 8: Record transaction data
Use the C\Prof ISPF dialog collect data from the CICS internal trace.
-
Return to the C\Prof primary option menu (PF3) and select option 1 Regions.
Collection statistics for each of your CICS regions are displayed. The Trace and Size columns report the status and table size of the internal trace for each CICS region. These values reflect the settings you assigned in Step 1: Start and configure the CICS internal trace.
-
To record profiling data from a CICS region, enter line action R.
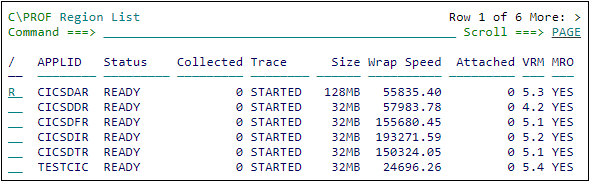
Submitting a profiling request using the Region List panel
Tip: To see a list of actions available for a CICS region, enter line action /.
-
Review the settings on the Start Collection panel. The Duration fields allow you to automatically terminate collection on the CICS region after the specified time limit. Specify any duration you wish, but for the purposes of this quick start guide, it is suggested that you enter a value of 5 Minutes.
-
To start recording, press Enter. The Region List is displayed once again.
-
Press Enter at any time to refresh the Region List. If you submitted a successful collection request, the value in the Status column changes to PROFILING. The value in the Collected column will increase to indicate successful data collection from the CICS internal trace. At this time, trace data is being written to new archive data sets which are, in turn, being registered by C\Prof in a checkpoint data set.
-
Optional: Review the collector SYSPRINT output data set to verify that collection has commenced and that archive data sets have been allocated.
...
CICS54D2 TXC0300I Monitoring of internal trace is starting: CICS TS V5.4 (710)
                  Size=32768K AP=1 EI=2 LD=1 PG=1 RA=1 RI=1 RM=1 XM=1 XS
CICS54D2 TXC0805I New archive data set was allocated;
                  DSN=USR.CPROF.CICS54D2.D160401.T130504.D001
...
Example collector SYSPRINT data set: collector startup sequence
Note: The CICS internal trace is a circular buffer where the oldest trace entries are continuously being overwritten with new entries due to ongoing activity in CICS. The pace at which this overwriting occurs is reported in the Wrap Speed column on the Region List panel. If a CICS region is busy and its internal trace table is small, its Wrap Speed will be short. If you are collecting from a CICS region with a short Wrap Speed, the C\Prof collection server may issue error message TXC0303E to indicate that the trace has wrapped before C\Prof could capture all the trace entries. As a result, collection must stop for the affected CICS region. If the CICS region belongs to a group that uses multiregion operation (MRO), collection must stop for these regions also.
To resolve wrapping issues in a CICS region: Try increasing the size of the internal trace table. More information can be found Step 1: Start and configure the CICS internal trace. Once you have increased the size of the trace, restart the collector, verify that the value in the Wrap Speed column has increased, and then resubmit your collection request. If increasing the size of the CICS internal trace table does not resolve the wrapping issues for this CICS region, review the additional optimization and troubleshooting methods in Configuring for optimum performance.
Step 9: Browse the transaction list
To analyze the results of collection, use the ISPF dialog.
-
On the C\Prof primary option menu, select option 1 Regions.
-
To view profiling data from a CICS region, enter line action S.
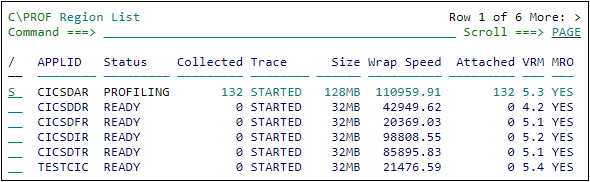
Viewing profiling data using the Region List panel
The Transaction Selection Criteria panel is displayed.
-
Enter 1 to specify a Relative date, and a time range that reaches back far enough to include those transactions you collected in Step 8: Record transaction data. For example, if 10 minutes have passed since you started the recording, select 15 Minutes ago to Now.
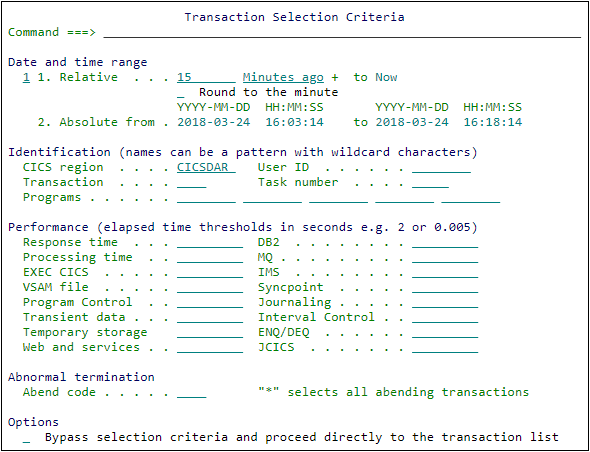
The Transaction Selection Criteria panel
-
Press Enter to see a list of transactions captured by C\Prof.
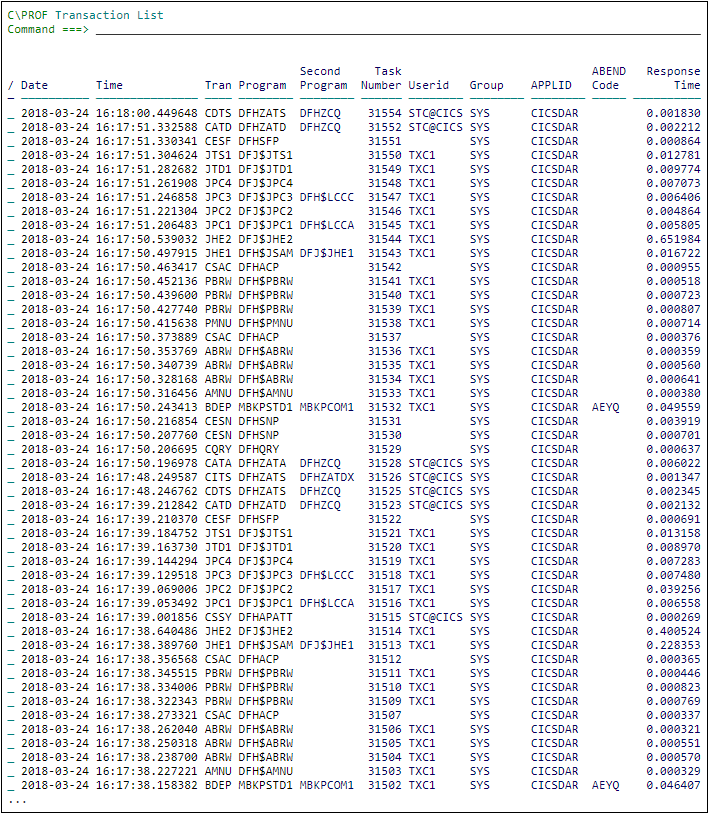
The Transaction List panel (ISPF)
Note: If you can t see any transactions, use the following methods to verify your setup:
- Check the status of the CICS internal trace. If you collect from a CICS region where the CICS internal trace is in the STOPPED state, only exception events will be captured. You can review the required settings in Step 1: Start and configure the CICS internal trace in Step 1: Start and configure the CICS internal trace.
- Review the C\Prof collection server SYSPRINT output data set. Check that new data sets are being allocated. Try running a transaction in the CICS region to stimulate the creation of an archive data set. Check for other warnings or errors. More information on messages issued by C\Prof can be found in Messages and codes.
- Relax the filtering criteria on the Transaction Selection Criteria panel. Select more transactions by specifying a longer relative time. More information can be found in Applying a filter to the transaction list (FILTER command).
- The ISPF dialog uses the checkpoint data set in your configuration file to retrieve archived transaction data. Check that you have used the same configuration file as your collector. You can specify a different configuration file at any time by overtyping the name in the Configuration field. Be sure to surround your data set name with single quotes (') when specifying a fully qualified data set name.
Step 10: Install the C\Prof Web UI (web server and application
The C\Prof Web UI is a web-browser based interface that supplements the transaction analysis capabilities of the C\Prof ISPF dialog. The C\Prof Web UI is installed as a web application bundled with its own copy of the Apache Tomcat application server into the z/OS UNIX environment on your mainframe. For more information on the functions of the C\Prof Web UI, see C\Prof Web UI.
To use the C\Prof Web UI, you must be running a C\Prof collection server.
Before you begin
Before you install the C\Prof Web UI, read the following important information:
-
As some installation files require extended attributes (program control), the installation must be performed by a z/OS UNIX administrator or a systems programmer with READ access to the BPX.FILEATTR.PROGCTL resource in the SAF FACILITY class.
-
To run the bundled Apache Tomcat application server, you must have READ access to the BPX.SERVER resource in the SAF FACILITY class.
-
The application server can be configured to use either unsecured connections with HTTP, or secured connections using HTTPS. HTTPS is highly recommended to ensure secure transmission of z/OS user IDs, passwords, and collected transaction data over your network. At a minimum, consider using HTTPS in production environments.
To use HTTPS, you must first create a keyring and connect to it a digital certificate. For more information, see Generating a keyring and certificate for secure connections.
If you are unsure which method to use, consider using HTTP on a demonstration or test system before reapplying this procedure for HTTPS.
Procedure
To install the C\Prof Web UI, complete the following steps:
-
Return to the C\Prof primary option menu (PF3) and select option 5 Configure.
-
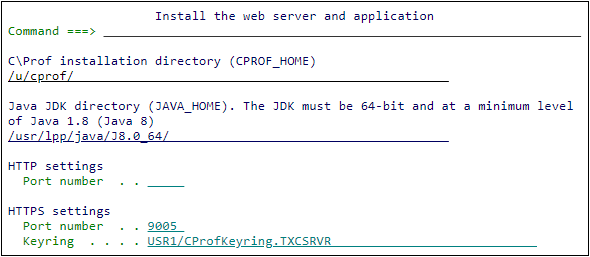
On the Configure the server panel, select option 7 Install the web server and application.
-
In the C\Prof installation directory (CPROF_HOME) field, enter an installation location for C\Prof Web UI (web server and application). For example, /u/cprof/.
-
In the Java JDK directory field, enter the path name of your Java 1.8 ("Java 8") installation (JAVA_HOME) in z\OS UNIX. The C\Prof Web UI requires the 64-bit version of Java 8 which is typically installed on your mainframe in /usr/lpp/java/J8.0_64/.
-
The C\Prof Web UI can be served using either HTTP (without security) or HTTPS (secure). These options are described below:
-
Configuring using HTTP
HTTP provides unsecured access to the C\Prof web server. If you wish to use HTTP, you only need to enter the TCP/IP port number that you wish to use to serve the C\Prof Web UI. To do this, use the Port number field in the HTTP settings section. Be sure to select a port on your system that is not being used by another application.
Note: In this configuration, z/OS user IDs and passwords will be transmitted across your network in plain text. To establish secure communication, use HTTPS (see below).
-
Configuring using HTTPS (recommended)
To use HTTPS to establish secure communication with the web server, enter the TCP/IP port number in the Port number field and the name of your SAF keyring with its associated user ID in the Keyring field of the HTTPS settings section. This user ID will also be the user account being used to run Apache Tomcat.
For example, for user USR1 with a keyring named CProfKeyring.TXCSRVR, enter
USR1/CProfKeyring.TXCSRVR.Note: If you have not yet created a keyring for the Apache Tomcat user, see Generating a keyring and certificate for secure connections.
The Web UI installation panel - HTTPS setup
-
-
Press enter to generate JCL to install the C\Prof Web UI.
-
Review and then submit the generated JCL. The batch job will perform the following actions:
-
Extract the C\Prof Web UI assets from its PAX archive file located in your C\Prof installation data set into your z\OS UNIX environment. This includes libraries for the application server as well as the C\Prof Web UI web application.
-
Update your application server's
server.xmlfile (an ASCII file located in theconfdirectory of your installation), used to configure your server with the options you selected in Steps 4 and 5. For more information on the structure of this file, see the Apache Tomcat Configuration Reference.
-
-
Review the job SYSOUT output data set for error messages. If the job completed successfully (return code 0), proceed to the next step.
Created directory /u/cprof
Extracting PAX archive
Running install.sh  --https-port 12345 --keyring USR1/CProfKeyring.TXCSRVR
bin/install.sh
Installation complete
Example SYSOUT output data set for successful HTTPS web server installation
If the job did not complete successfully, review any error messages, make changes and try again. Authorization errors may indicate that you have insufficient authority to define programs in UNIX files to program control. Contact your systems programmer or security administrator for assistance.
-
Return to the Configure the server panel and select option 8 Generate JCL to run the web server.
-
Enter the following information:
- The installation location you specified in step 3 in the C\Prof installation directory field
- The location of Java you specified in step 4 in the Java JDK directory field.
-
Press enter to generate JCL to run the web server.
-
Review and submit the generated JCL.
Note: The C\Prof Web UI communicates with the C\Prof collection server using the configuration file specified in the TXCCONF DD statement. If you wish to connect to a different collection server, simply change the file name as desired.
-
Review the STDERR output data set to verify that the server has started. For example:
29-Mar-2018 09:38:50.975 INFO [main] org.apache.catalina.startup.Catalina.start Server startup in 4500 msIf the job did not complete successfully, review any error messages, make changes, and try again.
-
Open a web browser to start using the C\Prof Web UI. For more information, see Logging on.
For more information on operating and configuring the server, see Web UI application server.
Step 11: Register the product
Note: C\Prof can be used without registering the product during the evaluation period. If you have purchased the product and received a product key, complete the following steps to register the product. If you have purchased the product but you do not yet have a product key, please contact Rocket Software product support.
To register your product, use the Configure the server panel.
-
Return to the C\Prof primary option menu (PF3) and select option 5 Configure.
-
On the Configure the server panel, select option 9 Activate C\PROF using the registration key.
-
Enter your product key into the space provided. Overwrite the text PLEASE PASTE THE KEY IN HERE.
For example:
TXCKEY CSECT , .C\PROF PRODUCT KEY
TXCKEY AMODE 31
TXCKEY RMODE ANY
*
*         *----+----1----+----2----+----3--*
&KEY SETC '19B395020BD365912231EDB19929CD37'
*         *----+----1----+----2----+----3--*
*
&CHECK SETC X2C('&KEY') .CHECK FOR VALID HEXADECIMAL DIGITS
DC CL32'&KEY' .THE ACTUAL KEY VALUE
*
END TXCKEY
Pasting your product key into the registration JCL (sample only)
-
Submit the generated JCL.
What to do next?
Now that you have completed your C\Prof setup, continue reading from one of the following subjects to learn more about the product:
Enterprise-wide data collection and analysis
Learn how to use C\Prof for data collection and analysis across your organization. In this section, you will learn more about the transaction profiler, how to view application events, and how to deep dive into the trace events themselves. You will learn how to record to auxiliary trace data sets and to take a back-in time snapshot, and how to import auxiliary trace data sets into the C\Prof transaction profiler. Finally, you will learn how to set up an automatic problem capture system using snapshot, and how to expand C\Prof collection to CICS regions in other LPARs.
Working with auxiliary trace data sets
If you are working primarily with auxiliary trace data sets, you can use the C\Prof trace viewer to browse formatted trace entries, or to import them into the C\Prof transaction profiler. If you have an auxiliary trace data set produced by the CICS auxiliary trace facility, you can use C\Prof to conduct advanced analysis.
Users who prefer to submit ad hoc batch data collection requests can generate JCL using the C\Prof ISPF dialog. With the dialog, you can generate JCL for transaction profiling, recording to auxiliary trace data sets, snapshot, and for importing auxiliary trace data sets into the C\Prof transaction profiler. If you have a CICS dump, you can also generate JCL to invoke IPCS with a C\Prof VERBEXIT that converts the dump into an auxiliary trace data set. Once you have your auxiliary trace data set, you can use the C\Prof trace viewer to view the trace entries, or you can import the auxiliary trace data set into the transaction profiler.
Explore the enhanced analysis capabilities of the C\Prof Web UI. For more information, see C\Prof Web UI.