 scale(1 -1)' gradientUnits='userSpaceOnUse'%3e%3cstop offset='0' stop-color='%23d257fc' /%3e%3cstop offset='.15' stop-color='%23b62dcc' /%3e%3cstop offset='.32' stop-color='%23909' /%3e%3cstop offset='.44' stop-color='%238312b6' /%3e%3cstop offset='.76' stop-color='%23503eff' /%3e%3c/linearGradient%3e%3c/defs%3e%3cg%3e%3cg%3e%3cpath fill='%23fff' d='M288.22,77.61c2.7-1.09,5.19-2.4,7.44-3.91,3.22-2.16,5.96-4.72,8.15-7.59,2.2-2.88,3.9-6.12,5.07-9.65,1.16-3.52,1.75-7.29,1.75-11.23,0-4.95-.86-9.56-2.57-13.71-1.73-4.21-4.49-7.87-8.18-10.88-3.65-2.97-8.36-5.31-14-6.94-5.57-1.61-12.32-2.43-20.06-2.43h-35.88V126.51h24.51v-43.55h6.98c2.15,0,3.24,.34,3.77,.62,.77,.41,1.51,1.16,2.21,2.23l23.43,35.68c1.03,1.58,2.33,2.83,3.84,3.69,1.54,.88,3.4,1.33,5.52,1.33h22.21l-29.9-44.11c-1.27-1.85-2.7-3.45-4.28-4.78Zm-33.77-46.52h11.37c7.17,0,12.52,1.39,15.88,4.12,3.29,2.68,4.89,6.46,4.89,11.56,0,2.58-.42,4.97-1.26,7.1-.81,2.08-2.07,3.91-3.72,5.42-1.67,1.53-3.86,2.76-6.49,3.65-2.69,.91-5.93,1.37-9.61,1.37h-11.06V31.09Z' /%3e%3cpath fill='%23fff' d='M386.19,53.94c-3.56-3.67-7.92-6.54-12.95-8.53-5.01-1.98-10.65-2.98-16.76-2.98s-11.77,1-16.8,2.98c-5.06,1.99-9.44,4.86-13.03,8.53-3.59,3.67-6.4,8.19-8.36,13.45-1.95,5.22-2.93,11.12-2.93,17.54s.99,12.39,2.93,17.61c1.96,5.26,4.77,9.81,8.35,13.52,3.59,3.73,7.98,6.63,13.04,8.62,5.03,1.98,10.68,2.98,16.8,2.98s11.76-1,16.76-2.98c5.04-1.99,9.4-4.89,12.96-8.62,3.56-3.72,6.34-8.27,8.27-13.53,1.92-5.22,2.89-11.14,2.89-17.61s-.97-12.31-2.89-17.53c-1.93-5.26-4.72-9.79-8.28-13.46Zm-16.65,49.47c-2.81,3.93-7.08,5.84-13.07,5.84s-10.43-1.92-13.27-5.88c-2.94-4.1-4.43-10.25-4.43-18.29s1.49-14.22,4.43-18.37c2.84-4,7.17-5.95,13.26-5.95s10.26,1.93,13.07,5.91c2.91,4.12,4.39,10.32,4.39,18.41s-1.48,14.25-4.39,18.33Z' /%3e%3cpath fill='%23fff' d='M462.91,102.23c-1.61,0-3.07,.51-4.36,1.52-.94,.74-2.04,1.54-3.27,2.41-1.16,.81-2.62,1.57-4.36,2.26-1.64,.65-3.89,.98-6.66,.98s-5.21-.52-7.36-1.55c-2.13-1.02-3.97-2.54-5.48-4.52-1.54-2.03-2.75-4.6-3.58-7.64-.85-3.11-1.28-6.73-1.28-10.75s.39-7.4,1.17-10.44c.76-2.96,1.91-5.5,3.43-7.56,1.47-2,3.35-3.55,5.58-4.62,2.25-1.08,4.93-1.63,7.97-1.63,2.4,0,4.42,.27,5.99,.79,1.64,.55,3.07,1.17,4.24,1.85,1.26,.73,2.35,1.39,3.25,1.96,1.23,.78,2.53,1.18,3.87,1.18,1.45,0,2.62-.34,3.49-1,.67-.51,1.33-1.18,2-2.03l6-8.3-1.14-1.14c-3.7-3.7-7.93-6.58-12.58-8.57-4.66-1.99-10.14-3-16.27-3-6.44,0-12.25,1.09-17.24,3.24-5.01,2.15-9.28,5.18-12.69,8.99-3.39,3.8-6,8.35-7.74,13.53-1.73,5.13-2.6,10.76-2.6,16.75,0,6.67,.99,12.71,2.93,17.96,1.95,5.27,4.65,9.8,8.01,13.45,3.38,3.68,7.4,6.52,11.95,8.44,4.53,1.91,9.42,2.88,14.53,2.88,2.85,0,5.77-.21,8.67-.64,2.95-.43,5.85-1.18,8.6-2.22,2.77-1.05,5.48-2.47,8.06-4.21,2.59-1.75,5.03-3.96,7.24-6.54l1.01-1.18-6.38-8.09c-1.12-1.67-2.85-2.55-5-2.55Z' /%3e%3cpath fill='%23fff' d='M529.12,81.74c-.39-.49-.81-.96-1.26-1.4,.43-.35,.85-.73,1.25-1.12,.97-.94,1.92-1.99,2.83-3.11l27.18-32.46h-21.46c-1.93,0-3.56,.39-4.83,1.16-1.15,.69-2.23,1.64-3.26,2.85l-19.63,24.25c-.81,.97-1.38,1.37-1.71,1.53-.25,.13-.87,.34-2.16,.34h-1.66V8.2h-22.81V126.51h22.81v-36.23h2.43c1.65,0,2.38,.23,2.67,.36,.25,.12,.78,.48,1.55,1.65l20.11,29.98c1,1.51,2.18,2.6,3.5,3.26,1.29,.64,2.84,.97,4.62,.97h20.77l-28.4-41.35c-.84-1.21-1.69-2.35-2.54-3.41Z' /%3e%3cpath fill='%23fff' d='M625.48,88.87c.94-.38,1.69-1.03,2.24-1.91,.48-.77,.79-1.75,.96-2.98,.14-1.04,.21-2.33,.21-3.84,0-5.91-.9-11.26-2.67-15.89-1.78-4.67-4.31-8.68-7.51-11.91-3.21-3.24-7.08-5.73-11.5-7.41-4.39-1.67-9.24-2.51-14.43-2.51-6.14,0-11.75,1.09-16.67,3.24-4.92,2.15-9.15,5.11-12.57,8.81-3.42,3.69-6.08,8.07-7.9,13.04-1.82,4.94-2.74,10.28-2.74,15.87,0,7.14,1.05,13.52,3.13,18.98,2.09,5.49,5,10.17,8.66,13.91,3.67,3.75,8.04,6.62,13,8.53,4.92,1.9,10.31,2.86,16.02,2.86,2.85,0,5.83-.21,8.85-.63,3.07-.43,6.12-1.17,9.07-2.21,2.98-1.05,5.87-2.46,8.6-4.2,2.76-1.76,5.29-3.97,7.51-6.57l1.01-1.19-6.47-8.09c-.58-.79-1.28-1.41-2.09-1.85-.84-.46-1.82-.69-2.91-.69-1.51,0-3.05,.45-4.6,1.33-1.23,.7-2.68,1.49-4.33,2.35-1.57,.82-3.44,1.58-5.56,2.27-2.03,.66-4.52,.99-7.4,.99-5.8,0-10.31-1.68-13.77-5.15-3.14-3.14-5.1-8.07-5.82-14.66h46.8c1.13,0,2.07-.16,2.87-.49Zm-49.09-14.77c.94-4.29,2.65-7.68,5.08-10.11,2.79-2.79,6.62-4.15,11.69-4.15,2.54,0,4.77,.42,6.62,1.26,1.84,.83,3.38,1.97,4.58,3.39,1.21,1.44,2.13,3.15,2.72,5.08,.44,1.43,.72,2.95,.85,4.54h-31.54Z' /%3e%3cpath fill='%23fff' d='M681.7,108.6l-.08-.12c-.52-.71-1.01-1.25-1.52-1.65-1.27-.99-3.22-1.16-4.92-.12-.43,.26-.92,.54-1.47,.82-.51,.27-1.13,.53-1.84,.78-.59,.21-1.37,.31-2.34,.31-1.53,0-2.65-.46-3.52-1.45-.91-1.03-1.37-2.55-1.37-4.53V61.69h20.81v-17.34h-20.81V19.45h-11.75c-1.55,0-2.88,.41-3.95,1.23-1.12,.85-1.84,2.04-2.14,3.55l-3.77,20.28-12.99,2.13v9.16c0,1.89,.59,3.37,1.75,4.41,1.1,.98,2.41,1.48,3.92,1.48h6.13v42.28c0,7.3,2.04,13.15,6.07,17.37,4.05,4.25,9.83,6.4,17.17,6.4,4.04,0,8-.63,11.77-1.87,3.81-1.25,7.23-3.13,10.18-5.58l1.26-1.05-6.56-10.64Z' /%3e%3c/g%3e%3cg%3e%3cpath fill='%23fff' d='M255.78,168.38c-.2,.4-.51,.6-.94,.6-.31,0-.72-.18-1.21-.53-.5-.35-1.15-.75-1.96-1.19-.81-.44-1.8-.84-2.98-1.19-1.18-.35-2.62-.53-4.32-.53-1.53,0-2.93,.22-4.19,.66-1.26,.44-2.34,1.03-3.24,1.76-.89,.74-1.59,1.59-2.09,2.57-.5,.98-.75,2-.75,3.08,0,1.33,.34,2.43,1.02,3.31,.68,.88,1.57,1.63,2.68,2.25,1.11,.62,2.36,1.16,3.77,1.61,1.4,.45,2.85,.91,4.32,1.36,1.48,.45,2.92,.96,4.32,1.51,1.4,.55,2.66,1.24,3.77,2.07,1.11,.82,2,1.83,2.68,3.02,.68,1.19,1.02,2.64,1.02,4.34,0,1.85-.33,3.56-1,5.15-.67,1.59-1.63,2.97-2.9,4.13-1.26,1.16-2.82,2.09-4.66,2.77-1.85,.68-3.95,1.02-6.3,1.02-2.98,0-5.55-.48-7.71-1.43-2.16-.95-4.09-2.19-5.79-3.73l.98-1.45c.14-.23,.3-.4,.47-.51,.17-.11,.41-.17,.72-.17,.37,0,.82,.23,1.36,.68s1.24,.94,2.11,1.47c.87,.53,1.94,1.02,3.24,1.47s2.89,.68,4.79,.68c1.79,0,3.36-.25,4.73-.75,1.36-.5,2.5-1.17,3.41-2.02s1.6-1.85,2.07-3,.7-2.36,.7-3.64c0-1.42-.34-2.6-1.02-3.53-.68-.94-1.58-1.73-2.68-2.38-1.11-.65-2.36-1.21-3.77-1.66-1.41-.45-2.85-.91-4.34-1.36s-2.94-.95-4.34-1.49c-1.4-.54-2.66-1.22-3.77-2.04-1.11-.82-2-1.82-2.68-3-.68-1.18-1.02-2.65-1.02-4.41,0-1.5,.33-2.95,.98-4.34,.65-1.39,1.58-2.61,2.79-3.66,1.21-1.05,2.68-1.89,4.41-2.51,1.73-.62,3.68-.94,5.83-.94,2.58,0,4.88,.37,6.88,1.12,2,.75,3.84,1.89,5.51,3.43l-.89,1.41Z' /%3e%3cpath fill='%23fff' d='M306.06,162.42c3.04,0,5.76,.52,8.15,1.55,2.4,1.04,4.42,2.51,6.07,4.41,1.65,1.9,2.9,4.19,3.77,6.88,.87,2.68,1.3,5.68,1.3,9.01s-.43,6.32-1.3,8.98c-.87,2.67-2.12,4.95-3.77,6.86-1.65,1.9-3.67,3.36-6.07,4.39-2.4,1.02-5.12,1.53-8.15,1.53s-5.76-.51-8.15-1.53c-2.4-1.02-4.43-2.48-6.09-4.39-1.66-1.9-2.92-4.19-3.79-6.86-.87-2.67-1.3-5.66-1.3-8.98s.43-6.32,1.3-9.01c.87-2.68,2.13-4.97,3.79-6.88,1.66-1.9,3.69-3.37,6.09-4.41,2.4-1.04,5.12-1.55,8.15-1.55Zm0,40.41c2.53,0,4.73-.43,6.62-1.3,1.89-.87,3.46-2.11,4.73-3.73,1.26-1.62,2.21-3.57,2.83-5.85,.62-2.29,.94-4.85,.94-7.69s-.31-5.37-.94-7.66c-.63-2.3-1.57-4.26-2.83-5.9-1.26-1.63-2.84-2.89-4.73-3.77-1.89-.88-4.1-1.32-6.62-1.32s-4.73,.44-6.62,1.32c-1.89,.88-3.46,2.14-4.73,3.77-1.26,1.63-2.21,3.6-2.85,5.9-.64,2.3-.96,4.85-.96,7.66s.32,5.4,.96,7.69c.64,2.29,1.59,4.24,2.85,5.85,1.26,1.62,2.84,2.86,4.73,3.73,1.89,.87,4.09,1.3,6.62,1.3Z' /%3e%3cpath fill='%23fff' d='M358.95,205.47v-37.94l-5.96-.38c-.82-.06-1.23-.41-1.23-1.06v-1.66h7.2v-5.36c0-2.41,.31-4.54,.94-6.37,.62-1.83,1.5-3.36,2.64-4.58,1.13-1.22,2.5-2.14,4.11-2.75,1.6-.61,3.37-.92,5.3-.92,.88,0,1.77,.08,2.66,.23,.89,.16,1.68,.38,2.36,.66l-.13,1.96c-.03,.4-.3,.6-.81,.6-.34,0-.8-.04-1.38-.13s-1.3-.13-2.15-.13c-1.39,0-2.68,.21-3.85,.62-1.18,.41-2.19,1.07-3.04,1.98s-1.51,2.09-1.98,3.56c-.47,1.46-.7,3.26-.7,5.39v5.24h13.75v3.02h-13.67v38.02h-4.05Z' /%3e%3cpath fill='%23fff' d='M419.75,206.15c-2.87,0-5.1-.79-6.68-2.38-1.59-1.59-2.38-4.04-2.38-7.37v-28.95h-6.09c-.31,0-.57-.09-.77-.26s-.3-.41-.3-.72v-1.58l7.24-.51,1.01-15.16c.03-.25,.13-.48,.32-.68,.18-.2,.43-.3,.74-.3h1.89v16.18h13.33v3.02h-13.33v28.74c0,1.16,.15,2.17,.45,3,.3,.84,.71,1.53,1.23,2.07,.52,.54,1.14,.94,1.85,1.19,.71,.26,1.48,.38,2.3,.38,1.02,0,1.9-.15,2.64-.45,.74-.3,1.38-.62,1.92-.98,.54-.35,.98-.68,1.32-.98,.34-.3,.61-.45,.81-.45,.23,0,.45,.14,.68,.43l1.11,1.79c-1.08,1.19-2.45,2.15-4.11,2.87-1.66,.72-3.38,1.09-5.17,1.09Z' /%3e%3cpath fill='%23fff' d='M453.22,163.1h3.11c.4,0,.72,.11,.98,.32,.26,.21,.43,.45,.51,.7l10.69,33.43c.2,.65,.35,1.28,.47,1.87,.11,.6,.23,1.19,.34,1.79,.14-.6,.3-1.19,.47-1.79,.17-.6,.37-1.22,.6-1.87l11.37-33.72c.2-.62,.6-.94,1.19-.94h1.66c.62,0,1.04,.31,1.23,.94l11.2,33.72c.43,1.28,.77,2.51,1.02,3.7,.11-.6,.23-1.2,.36-1.81,.13-.61,.31-1.24,.53-1.89l10.73-33.43c.23-.68,.71-1.02,1.45-1.02h2.98l-14.18,42.37h-2.98c-.45,0-.78-.3-.98-.89l-11.63-34.4c-.14-.43-.27-.85-.38-1.28-.11-.43-.21-.85-.3-1.28-.09,.43-.18,.85-.28,1.28-.1,.43-.22,.85-.36,1.28l-11.75,34.4c-.17,.6-.51,.89-1.02,.89h-2.85l-14.18-42.37Z' /%3e%3cpath fill='%23fff' d='M568.48,205.47c-.85,0-1.38-.4-1.58-1.19l-.6-5.41c-1.16,1.13-2.32,2.16-3.47,3.07-1.15,.91-2.35,1.67-3.6,2.3-1.25,.62-2.6,1.1-4.05,1.43-1.45,.33-3.04,.49-4.77,.49-1.45,0-2.85-.21-4.22-.64-1.36-.43-2.57-1.08-3.62-1.96-1.05-.88-1.89-2.01-2.53-3.39-.64-1.38-.96-3.03-.96-4.96,0-1.79,.51-3.45,1.53-4.98,1.02-1.53,2.62-2.87,4.79-4,2.17-1.14,4.97-2.04,8.39-2.73,3.42-.68,7.53-1.08,12.33-1.19v-4.43c0-3.92-.84-6.93-2.53-9.05-1.69-2.11-4.19-3.17-7.52-3.17-2.04,0-3.78,.28-5.22,.85-1.43,.57-2.65,1.19-3.64,1.87-.99,.68-1.8,1.31-2.43,1.87-.62,.57-1.15,.85-1.58,.85-.57,0-.99-.25-1.28-.77l-.72-1.23c2.21-2.21,4.54-3.89,6.98-5.02,2.44-1.14,5.21-1.7,8.3-1.7,2.27,0,4.26,.36,5.96,1.09s3.11,1.76,4.24,3.11c1.12,1.35,1.97,2.98,2.53,4.9,.57,1.92,.85,4.05,.85,6.41v27.59h-1.62Zm-17.03-2.26c1.65,0,3.16-.18,4.54-.53,1.38-.35,2.65-.85,3.83-1.49s2.28-1.4,3.3-2.28c1.02-.88,2.03-1.83,3.02-2.85v-11.03c-4.03,.11-7.5,.42-10.41,.92s-5.31,1.17-7.2,2.02-3.28,1.87-4.17,3.04c-.89,1.18-1.34,2.52-1.34,4.02,0,1.42,.23,2.65,.7,3.68,.47,1.04,1.09,1.89,1.85,2.55,.77,.67,1.66,1.16,2.68,1.47,1.02,.31,2.09,.47,3.19,.47Z' /%3e%3cpath fill='%23fff' d='M603.74,205.47v-42.37h2.13c.48,0,.83,.1,1.04,.3,.21,.2,.33,.54,.36,1.02l.34,8.94c1.36-3.43,3.18-6.12,5.45-8.07,2.27-1.94,5.07-2.92,8.39-2.92,1.28,0,2.45,.13,3.53,.4s2.1,.66,3.07,1.17l-.55,2.81c-.09,.45-.37,.68-.85,.68-.17,0-.41-.06-.72-.17-.31-.11-.7-.24-1.17-.38s-1.04-.27-1.72-.38c-.68-.11-1.46-.17-2.34-.17-3.21,0-5.84,.99-7.9,2.98-2.06,1.99-3.73,4.85-5,8.6v27.55h-4.04Z' /%3e%3cpath fill='%23fff' d='M668.25,162.42c2.38,0,4.59,.41,6.62,1.23s3.79,2.02,5.28,3.6c1.49,1.57,2.65,3.51,3.49,5.81,.84,2.3,1.26,4.94,1.26,7.92,0,.63-.09,1.05-.28,1.28s-.47,.34-.87,.34h-30.57v.81c0,3.18,.37,5.98,1.11,8.39,.74,2.41,1.79,4.44,3.15,6.07,1.36,1.63,3.01,2.86,4.94,3.68,1.93,.82,4.09,1.23,6.47,1.23,2.13,0,3.97-.23,5.54-.7s2.87-.99,3.94-1.57c1.06-.58,1.91-1.11,2.53-1.58s1.08-.7,1.36-.7c.37,0,.65,.14,.85,.43l1.11,1.36c-.68,.85-1.58,1.65-2.7,2.38-1.12,.74-2.37,1.37-3.75,1.89s-2.85,.94-4.43,1.26c-1.58,.31-3.16,.47-4.75,.47-2.9,0-5.54-.5-7.92-1.51s-4.43-2.48-6.14-4.41c-1.71-1.93-3.03-4.29-3.96-7.09-.93-2.8-1.4-6-1.4-9.6,0-3.04,.43-5.84,1.3-8.41,.87-2.57,2.11-4.78,3.75-6.64,1.63-1.86,3.63-3.31,6-4.36,2.37-1.05,5.06-1.58,8.07-1.58Zm.06,3.02c-2.18,0-4.14,.34-5.87,1.02-1.73,.68-3.22,1.66-4.49,2.94-1.26,1.28-2.28,2.81-3.06,4.6-.78,1.79-1.3,3.79-1.55,6h27.89c0-2.27-.31-4.31-.93-6.11-.62-1.8-1.5-3.33-2.64-4.58s-2.49-2.21-4.08-2.87c-1.59-.67-3.34-1-5.27-1Z' /%3e%3c/g%3e%3cpath fill='url(%23BLAST)' fill-rule='evenodd' d='M4.12,92.96c-1.43-.39-2.64-1.32-3.38-2.6-.74-1.28-.93-2.8-.55-4.23,.39-1.43,1.32-2.64,2.6-3.38,1.28-.74,2.8-.93,4.23-.55l50.57,13.55h0c3.17,.87,6.52,.91,9.71,.08l.28-.07c3.05-.91,5.82-2.58,8.05-4.86l.02,.02L156.93,9.65c1.05-1.05,2.46-1.63,3.94-1.63s2.9,.59,3.94,1.63c1.05,1.05,1.63,2.46,1.63,3.94s-.59,2.9-1.63,3.94L83.55,98.8v.02c-3.58,3.64-8.06,6.28-12.98,7.69-.13,.04-.25,.08-.38,.12-5.07,1.34-10.4,1.31-15.46-.09h0S4.12,92.96,4.12,92.96Zm18.81-18.77l25.88,6.93c5.06,1.41,10.4,1.43,15.47,.08,5.07-1.36,9.69-4.05,13.37-7.79l33.19-33.19c1.05-1.05,1.64-2.48,1.64-3.96s-.59-2.91-1.64-3.96-2.48-1.64-3.96-1.64-2.91,.59-3.96,1.64l-33.19,33.19c-2.47,2.47-5.32,4.13-8.36,4.95-3.04,.81-6.33,.8-9.69-.1l-25.87-6.93c-.71-.2-1.46-.26-2.2-.17-.74,.09-1.45,.32-2.09,.69-.65,.37-1.21,.86-1.66,1.45-.45,.59-.79,1.26-.98,1.98-.19,.72-.24,1.47-.14,2.2,.1,.74,.35,1.44,.73,2.08,.38,.64,.88,1.2,1.47,1.64,.6,.44,1.27,.76,1.99,.94Zm101.03,124.93l-13.55-50.57c-.88-3.17-.92-6.52-.09-9.7l.07-.29c.9-3.05,2.57-5.83,4.84-8.06L196.5,49.22c1.05-1.05,1.63-2.46,1.63-3.94s-.59-2.9-1.63-3.94c-1.05-1.05-2.46-1.63-3.94-1.63-1.48,0-2.9,.59-3.94,1.63L107.36,122.6c-3.65,3.59-6.3,8.06-7.71,12.97-.04,.13-.08,.25-.12,.38-1.34,5.07-1.31,10.4,.09,15.46h.01l13.56,50.61c.39,1.43,1.32,2.64,2.6,3.38,1.28,.74,2.8,.93,4.23,.55,1.43-.39,2.64-1.32,3.38-2.6,.74-1.28,.93-2.8,.55-4.23h0Zm18.79-18.79l-6.93-25.86c-.88-3.17-.92-6.52-.09-9.71l.07-.28c.91-3.05,2.58-5.82,4.86-8.05l33.2-33.19c1.05-1.05,1.64-2.48,1.64-3.96s-.59-2.91-1.64-3.96c-1.05-1.05-2.48-1.64-3.96-1.64s-2.91,.59-3.96,1.64l-33.18,33.2c-3.64,3.6-6.29,8.07-7.69,12.99-.04,.12-.08,.25-.12,.38-1.34,5.07-1.31,10.4,.09,15.46h.01l6.94,25.9c.19,.71,.52,1.37,.97,1.95,.45,.58,1,1.07,1.64,1.43,.63,.37,1.34,.6,2.06,.7,.73,.09,1.46,.04,2.17-.15,.71-.19,1.37-.52,1.95-.97s1.07-1,1.43-1.64c.36-.63,.6-1.34,.69-2.06,.09-.73,.04-1.46-.15-2.17h0ZM185.84,12.4L16.74,181.48c-1.05,1.05-1.64,2.48-1.64,3.96s.59,2.91,1.64,3.96c1.05,1.05,2.48,1.64,3.96,1.64s2.91-.59,3.96-1.64L193.75,20.31c1.03-1.05,1.6-2.47,1.59-3.94-.01-1.47-.6-2.88-1.64-3.92-1.04-1.04-2.45-1.63-3.92-1.64-1.47-.01-2.89,.56-3.94,1.59ZM51.18,115.37L15.8,150.75c-1.05,1.05-1.64,2.48-1.64,3.96,0,1.49,.59,2.91,1.64,3.96,1.05,1.05,2.48,1.64,3.96,1.64,1.49,0,2.91-.59,3.96-1.64l35.37-35.38c.52-.52,.93-1.14,1.22-1.82,.28-.68,.43-1.41,.43-2.14s-.14-1.47-.43-2.15c-.28-.68-.69-1.3-1.22-1.82-.52-.52-1.14-.93-1.82-1.22-.68-.28-1.41-.43-2.15-.43s-1.47,.15-2.15,.43c-.68,.28-1.3,.7-1.82,1.22v.02Zm31.7,31.68l-35.38,35.39c-1.05,1.05-1.64,2.48-1.64,3.96,0,1.49,.59,2.91,1.64,3.96,1.05,1.05,2.48,1.64,3.96,1.64,1.49,0,2.91-.59,3.96-1.64l35.37-35.39c1.03-1.06,1.6-2.47,1.59-3.94-.01-1.47-.6-2.88-1.64-3.92s-2.45-1.63-3.92-1.64c-1.47,0-2.89,.56-3.94,1.59Z' /%3e%3c/g%3e%3cpath fill='%23fff' d='M679.92,14.02c0-1.29,.17-2.53,.5-3.73,.33-1.19,.8-2.31,1.41-3.35,.61-1.04,1.34-1.98,2.19-2.83,.85-.85,1.8-1.58,2.84-2.19,1.03-.61,2.15-1.08,3.33-1.42,1.19-.33,2.43-.5,3.72-.5s2.53,.17,3.73,.5c1.19,.33,2.31,.8,3.34,1.42,1.04,.61,1.98,1.34,2.84,2.19s1.59,1.79,2.19,2.83c.61,1.04,1.08,2.16,1.41,3.35,.33,1.19,.5,2.44,.5,3.73s-.17,2.51-.5,3.71c-.33,1.19-.8,2.31-1.41,3.34-.61,1.03-1.34,1.98-2.19,2.83-.86,.85-1.8,1.58-2.84,2.19-1.03,.61-2.15,1.09-3.34,1.42-1.2,.33-2.44,.5-3.73,.5s-2.53-.17-3.72-.5c-1.19-.33-2.3-.8-3.33-1.42-1.04-.61-1.98-1.34-2.84-2.19-.86-.85-1.59-1.79-2.19-2.83-.61-1.03-1.08-2.14-1.41-3.33-.33-1.19-.5-2.43-.5-3.72Zm1.92,0c0,1.14,.14,2.23,.42,3.28,.28,1.05,.68,2.03,1.21,2.94,.52,.91,1.15,1.74,1.88,2.48,.73,.74,1.54,1.38,2.43,1.91s1.86,.94,2.89,1.23c1.04,.29,2.11,.43,3.24,.43,1.69,0,3.27-.32,4.74-.96s2.76-1.51,3.85-2.61c1.09-1.1,1.96-2.4,2.59-3.89,.63-1.49,.95-3.09,.95-4.8,0-1.14-.14-2.23-.43-3.29-.29-1.06-.69-2.05-1.22-2.96s-1.15-1.75-1.89-2.5c-.73-.75-1.55-1.39-2.44-1.92-.89-.53-1.86-.94-2.9-1.24-1.04-.29-2.12-.44-3.25-.44-1.69,0-3.26,.32-4.73,.97-1.47,.65-2.75,1.53-3.83,2.64-1.09,1.12-1.94,2.43-2.57,3.93s-.94,3.11-.94,4.82Zm9.31,1.72v6.78h-2.99V5.44h5.52c2.2,0,3.83,.4,4.89,1.2s1.59,1.97,1.59,3.53c0,1.2-.34,2.22-1.03,3.06s-1.7,1.42-3.06,1.74c.22,.13,.41,.29,.57,.48s.31,.42,.45,.67l4.37,6.4h-2.84c-.42,0-.73-.16-.94-.48l-3.85-5.78c-.11-.17-.25-.29-.41-.38-.16-.09-.41-.13-.74-.13h-1.53Zm0-2.18h2.22c.7,0,1.3-.07,1.79-.2,.49-.13,.89-.33,1.19-.58,.3-.26,.52-.57,.65-.94,.13-.37,.2-.8,.2-1.28s-.06-.89-.18-1.25c-.12-.36-.32-.65-.59-.88s-.64-.4-1.08-.52c-.45-.11-1-.17-1.67-.17h-2.53v5.82Z' /%3e%3c/svg%3e)
Events inside the CICS internal trace are captured by the C\Prof collection task (collector). Run C\Prof as a collection server servicing requests from either the ISPF dialog or the C\Prof Web UI, or submit ad hoc batch requests using JCL.
C\Prof has the following trace capture modes:
-
Transaction profiling (ISPF, Web UI)
Profiling provides an application perspective of the trace. The C\Prof collector reads the internal trace to keep detailed information about transactions whilst the user interface provides near real-time access to the transaction information.
Reveal more about your CICS regions with the following capabilities:
-
Sift through thousands of transactions to quickly identify problems.
-
See response time broken down into processing parts. Move across program links, including regions using multiregion operation (MRO).
-
View a timeline of application calls. See EXEC CICS, DB2, MQ, IMS and Java statements together with the call's elapsed time, response code, and command text.
-
Display the trace events behind the transaction to quickly determine the root cause of a delay or problem.
-
-
Snap peeks back in time to capture what has recently happened in CICS. It does this by taking a point-in-time copy of the CICS internal trace and writes it to an auxiliary trace data set. Snap has no dependence on the CICS auxiliary trace facility. As such, it is very fast and has almost no impact on CICS.
To demonstrate, observe the following snap statistics for a snapshot of three CICS regions with a combined internal trace size of 200 MB:
- Job steps: 1
- Elapsed time: 1 second
- CPU time: 0.2 seconds
- Output: 3 auxiliary trace data sets totaling 275 DASD cylinders
- Impact on CICS: None
Once the auxiliary trace data sets have been written, you can analyze them using C\Prof, or using the CICS trace utility program.
-
Record to auxiliary trace data sets (ISPF)
Recording to auxiliary trace data sets provides a similar functionality to the CICS auxiliary trace facility but with far less overhead. Recording does not involve or require any changes to CICS.
Record for transaction profiling
Profiling provides an application perspective of the trace. C\Prof uses the CICS internal trace to keep detailed information about transaction behavior while the user interface provides near real-time access to the archived collection data. Transactions can be traced across multiple CICS regions while the regions themselves remain unaffected by the process.
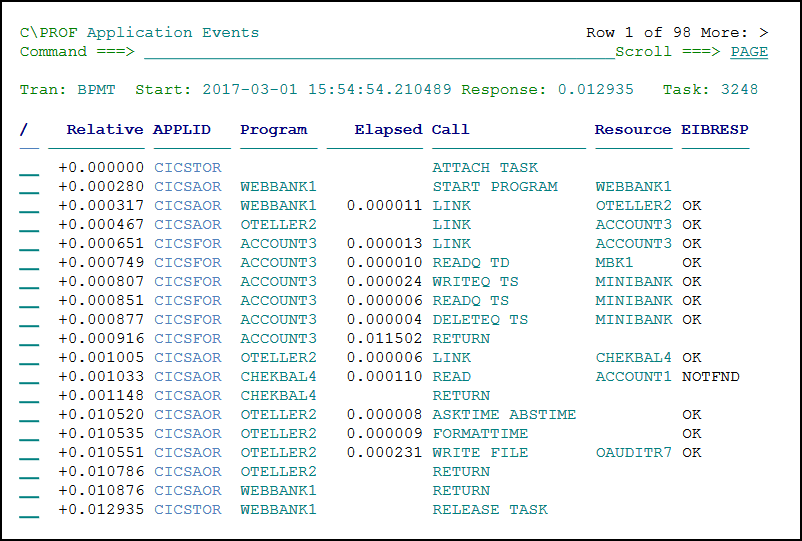
 Viewing a timeline of application calls made by a transaction in C\Prof (ISPF)
![]()
Viewing a timeline of application calls made by a transaction in C\Prof (Web UI)
The C\Prof user interfaces are powered by the transaction information collected and stored in C\Prof archive data sets. Collection settings and storage attributes are defined by a simple configuration file.
![]()
A list of transactions collected by C\Prof (ISPF)
![]()
A list of transactions collected by C\Prof (Web UI)
Snap the CICS internal trace
The CICS internal trace is a circular buffer in which the oldest trace entries are continuously being overwritten with new entries due to ongoing activity in CICS. If a problem occurs in CICS, trace events relating to recent problems in CICS will persist inside the CICS internal trace for a period before they are eventually overwritten by newer entries. If we are fast enough, we can capture those trace events by taking a copy of the trace table. In C\Prof, this process for capturing the recent history of events in CICS is called a "snapshot".
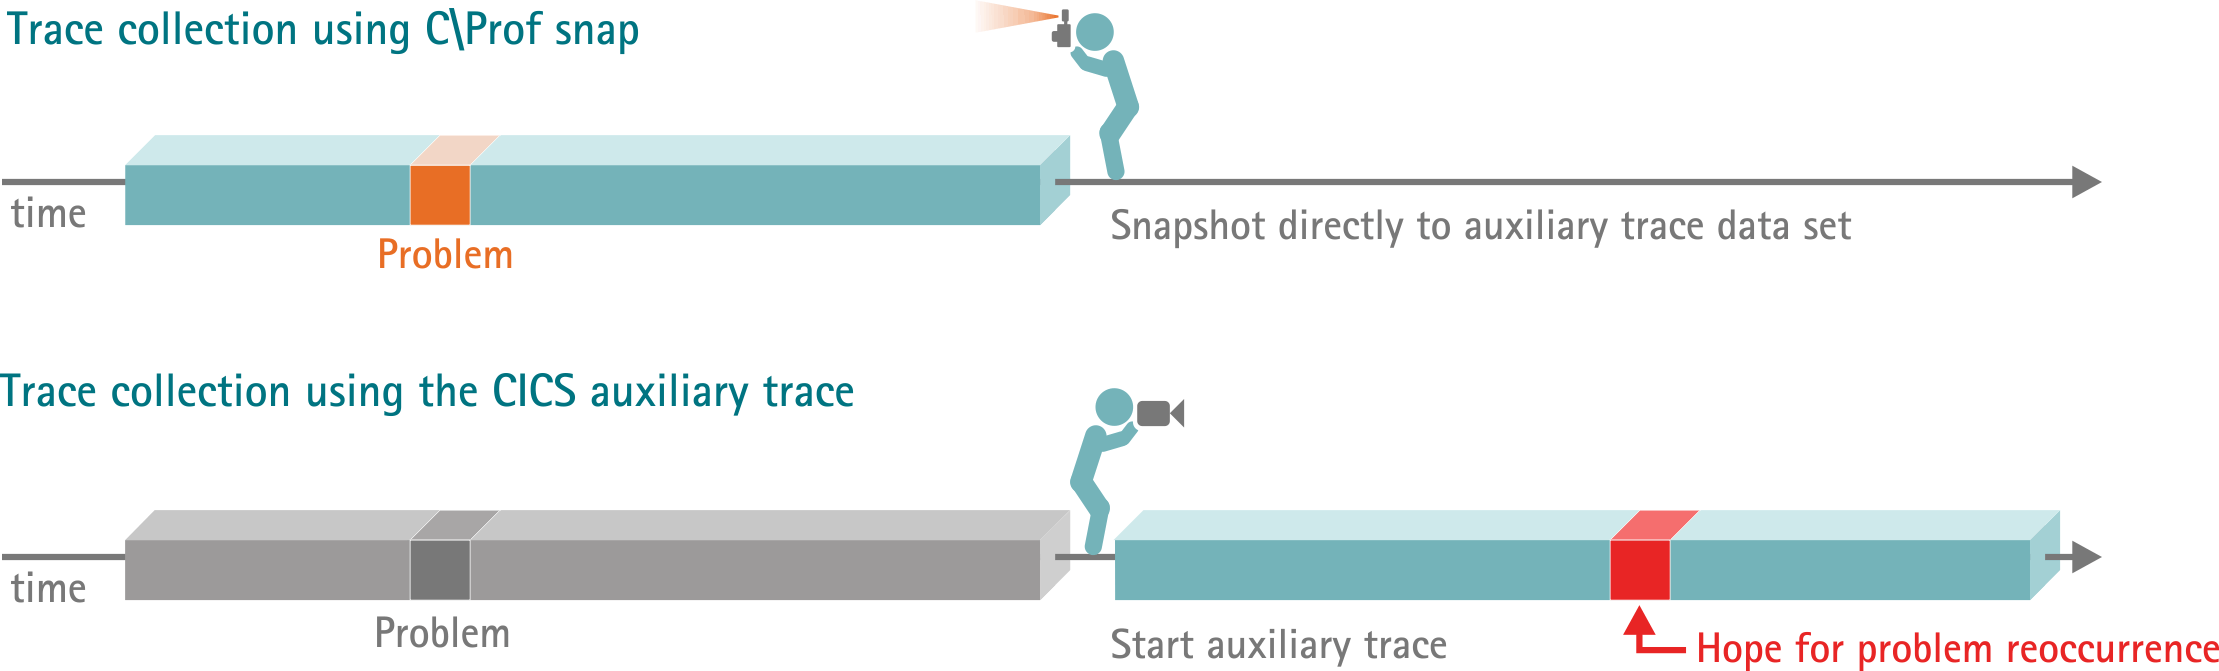
Collecting from the trace: C\Prof snap (historical collection) versus the CICS auxiliary trace facility
Snap is very lightweight and typically completes within a few seconds, depending on the size of the trace. View the resulting auxiliary trace data set with the CICS trace utility print program, the C\Prof trace viewer, or import it into the C\Prof transaction profiler as required.
Record to CICS auxiliary trace data sets
A C\Prof recording to an auxiliary trace data set produces output identical to the CICS auxiliary trace facility but with a much lower processing burden. Configure and manage collection from the C\Prof ISPF dialog, use the C\Prof trace viewer to view the results, import data into the profiler, and share data quickly and easily with the C\Prof configuration file.
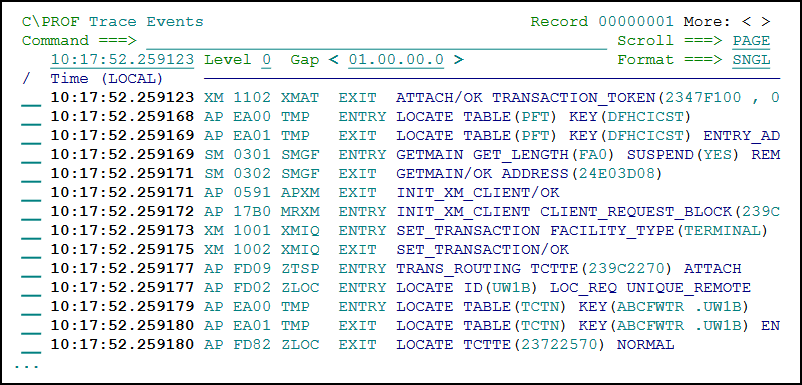
C\Prof trace events viewer