Applications can write their own custom trace entries which can then be viewed by C\Prof. You can use this facility to add additional tracing information to your programs or to view custom tracing that may already exist. To see these entries, users must configure their collector configuration file as follows:
-
Set the LEVEL control statement to 2 or higher (see LEVEL=value)
-
Set the EI and AP trace point domains to 1 or higher using the ACTIVATETRACE control statement (see ACTIVATETRACE) and/or using STNTRxx control statements (see STNTRxx)
You can use the following COBOL and Java code examples to create your own trace entries from within your CICS applications:
COBOL trace entries
COBOL applications can use the CICS ENTER TRACENUM command.
The ENTER TRACENUM command makes a trace entry in the currently active trace destinations. CICS writes the trace entry only if the master and user trace flags are on, unless you specify the EXCEPTION option, in which case a user trace entry is always written, even if the master and user trace flags are off. Exception trace entries are always written to the internal trace table (even if internal tracing is set off), but they are written to other destinations only if they are active.
The following example shows how to write a user trace entry with a trace identifier of 123, with trace data from a data area called USER-TRACE-ENTRY:
EXEC CICS ENTER TRACENUM(123)
     FROM(USER-TRACE-ENTRY)
END-EXEC.
Writing a custom trace entry using EXEC CICS ENTER TRACENUM
For more information, refer to the ENTER TRACENUM topic in the CICS Transaction Server user documentation in the IBM Knowledge Center.
Java trace entries
Java applications running in CICS can write trace entries using the EnterRequest JCICS class. This class provides similar functionality to the ENTER TRACENUM command described above.
The following example shows how to write an exception trace entry containing the contents of a container:
import com.ibm.cics.server.EnterRequest;
. . .
// Get the container data
Container contOut = chan.getContainer(containerNameOut);
byte[] response = contOut.get();

// Write a trace entry
EnterRequest er = new EnterRequest();
er.setException(true);              // Application program exception (optional)
er.setResource("ABCDEF");           // 8 byte resource field
er.setTraceIdentifier((short)0102); // ID number
er.enterTrace(response);            // Byte array
Writing a custom trace entry using Java and JCICS
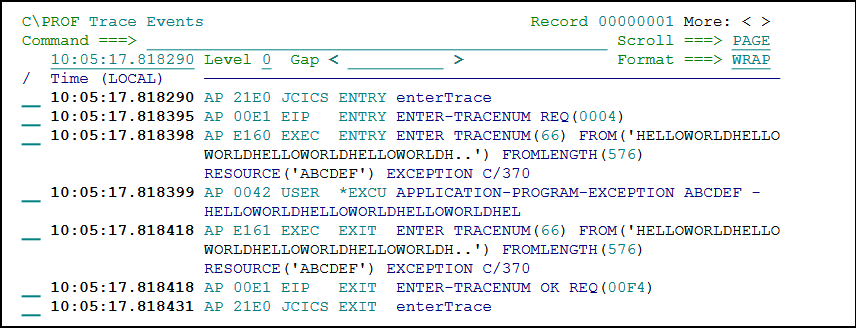
C\Prof captures and displays the trace entries as follows:
 Viewing user-written trace entries in the C\Prof ISPF dialog
In the ISPF dialog, view the complete record using line action S. You can also view these entries in the C\Prof Web UI.
 Viewing custom trace entries in the C\Prof Web UI
For more information on writing your own trace entries in Java, refer to the Class EnterRequest topic in the CICS Transaction Server user documentation in the IBM Knowledge Center.