 scale(1 -1)' gradientUnits='userSpaceOnUse'%3e%3cstop offset='0' stop-color='%23d257fc' /%3e%3cstop offset='.15' stop-color='%23b62dcc' /%3e%3cstop offset='.32' stop-color='%23909' /%3e%3cstop offset='.44' stop-color='%238312b6' /%3e%3cstop offset='.76' stop-color='%23503eff' /%3e%3c/linearGradient%3e%3c/defs%3e%3cg%3e%3cg%3e%3cpath fill='%23fff' d='M288.22,77.61c2.7-1.09,5.19-2.4,7.44-3.91,3.22-2.16,5.96-4.72,8.15-7.59,2.2-2.88,3.9-6.12,5.07-9.65,1.16-3.52,1.75-7.29,1.75-11.23,0-4.95-.86-9.56-2.57-13.71-1.73-4.21-4.49-7.87-8.18-10.88-3.65-2.97-8.36-5.31-14-6.94-5.57-1.61-12.32-2.43-20.06-2.43h-35.88V126.51h24.51v-43.55h6.98c2.15,0,3.24,.34,3.77,.62,.77,.41,1.51,1.16,2.21,2.23l23.43,35.68c1.03,1.58,2.33,2.83,3.84,3.69,1.54,.88,3.4,1.33,5.52,1.33h22.21l-29.9-44.11c-1.27-1.85-2.7-3.45-4.28-4.78Zm-33.77-46.52h11.37c7.17,0,12.52,1.39,15.88,4.12,3.29,2.68,4.89,6.46,4.89,11.56,0,2.58-.42,4.97-1.26,7.1-.81,2.08-2.07,3.91-3.72,5.42-1.67,1.53-3.86,2.76-6.49,3.65-2.69,.91-5.93,1.37-9.61,1.37h-11.06V31.09Z' /%3e%3cpath fill='%23fff' d='M386.19,53.94c-3.56-3.67-7.92-6.54-12.95-8.53-5.01-1.98-10.65-2.98-16.76-2.98s-11.77,1-16.8,2.98c-5.06,1.99-9.44,4.86-13.03,8.53-3.59,3.67-6.4,8.19-8.36,13.45-1.95,5.22-2.93,11.12-2.93,17.54s.99,12.39,2.93,17.61c1.96,5.26,4.77,9.81,8.35,13.52,3.59,3.73,7.98,6.63,13.04,8.62,5.03,1.98,10.68,2.98,16.8,2.98s11.76-1,16.76-2.98c5.04-1.99,9.4-4.89,12.96-8.62,3.56-3.72,6.34-8.27,8.27-13.53,1.92-5.22,2.89-11.14,2.89-17.61s-.97-12.31-2.89-17.53c-1.93-5.26-4.72-9.79-8.28-13.46Zm-16.65,49.47c-2.81,3.93-7.08,5.84-13.07,5.84s-10.43-1.92-13.27-5.88c-2.94-4.1-4.43-10.25-4.43-18.29s1.49-14.22,4.43-18.37c2.84-4,7.17-5.95,13.26-5.95s10.26,1.93,13.07,5.91c2.91,4.12,4.39,10.32,4.39,18.41s-1.48,14.25-4.39,18.33Z' /%3e%3cpath fill='%23fff' d='M462.91,102.23c-1.61,0-3.07,.51-4.36,1.52-.94,.74-2.04,1.54-3.27,2.41-1.16,.81-2.62,1.57-4.36,2.26-1.64,.65-3.89,.98-6.66,.98s-5.21-.52-7.36-1.55c-2.13-1.02-3.97-2.54-5.48-4.52-1.54-2.03-2.75-4.6-3.58-7.64-.85-3.11-1.28-6.73-1.28-10.75s.39-7.4,1.17-10.44c.76-2.96,1.91-5.5,3.43-7.56,1.47-2,3.35-3.55,5.58-4.62,2.25-1.08,4.93-1.63,7.97-1.63,2.4,0,4.42,.27,5.99,.79,1.64,.55,3.07,1.17,4.24,1.85,1.26,.73,2.35,1.39,3.25,1.96,1.23,.78,2.53,1.18,3.87,1.18,1.45,0,2.62-.34,3.49-1,.67-.51,1.33-1.18,2-2.03l6-8.3-1.14-1.14c-3.7-3.7-7.93-6.58-12.58-8.57-4.66-1.99-10.14-3-16.27-3-6.44,0-12.25,1.09-17.24,3.24-5.01,2.15-9.28,5.18-12.69,8.99-3.39,3.8-6,8.35-7.74,13.53-1.73,5.13-2.6,10.76-2.6,16.75,0,6.67,.99,12.71,2.93,17.96,1.95,5.27,4.65,9.8,8.01,13.45,3.38,3.68,7.4,6.52,11.95,8.44,4.53,1.91,9.42,2.88,14.53,2.88,2.85,0,5.77-.21,8.67-.64,2.95-.43,5.85-1.18,8.6-2.22,2.77-1.05,5.48-2.47,8.06-4.21,2.59-1.75,5.03-3.96,7.24-6.54l1.01-1.18-6.38-8.09c-1.12-1.67-2.85-2.55-5-2.55Z' /%3e%3cpath fill='%23fff' d='M529.12,81.74c-.39-.49-.81-.96-1.26-1.4,.43-.35,.85-.73,1.25-1.12,.97-.94,1.92-1.99,2.83-3.11l27.18-32.46h-21.46c-1.93,0-3.56,.39-4.83,1.16-1.15,.69-2.23,1.64-3.26,2.85l-19.63,24.25c-.81,.97-1.38,1.37-1.71,1.53-.25,.13-.87,.34-2.16,.34h-1.66V8.2h-22.81V126.51h22.81v-36.23h2.43c1.65,0,2.38,.23,2.67,.36,.25,.12,.78,.48,1.55,1.65l20.11,29.98c1,1.51,2.18,2.6,3.5,3.26,1.29,.64,2.84,.97,4.62,.97h20.77l-28.4-41.35c-.84-1.21-1.69-2.35-2.54-3.41Z' /%3e%3cpath fill='%23fff' d='M625.48,88.87c.94-.38,1.69-1.03,2.24-1.91,.48-.77,.79-1.75,.96-2.98,.14-1.04,.21-2.33,.21-3.84,0-5.91-.9-11.26-2.67-15.89-1.78-4.67-4.31-8.68-7.51-11.91-3.21-3.24-7.08-5.73-11.5-7.41-4.39-1.67-9.24-2.51-14.43-2.51-6.14,0-11.75,1.09-16.67,3.24-4.92,2.15-9.15,5.11-12.57,8.81-3.42,3.69-6.08,8.07-7.9,13.04-1.82,4.94-2.74,10.28-2.74,15.87,0,7.14,1.05,13.52,3.13,18.98,2.09,5.49,5,10.17,8.66,13.91,3.67,3.75,8.04,6.62,13,8.53,4.92,1.9,10.31,2.86,16.02,2.86,2.85,0,5.83-.21,8.85-.63,3.07-.43,6.12-1.17,9.07-2.21,2.98-1.05,5.87-2.46,8.6-4.2,2.76-1.76,5.29-3.97,7.51-6.57l1.01-1.19-6.47-8.09c-.58-.79-1.28-1.41-2.09-1.85-.84-.46-1.82-.69-2.91-.69-1.51,0-3.05,.45-4.6,1.33-1.23,.7-2.68,1.49-4.33,2.35-1.57,.82-3.44,1.58-5.56,2.27-2.03,.66-4.52,.99-7.4,.99-5.8,0-10.31-1.68-13.77-5.15-3.14-3.14-5.1-8.07-5.82-14.66h46.8c1.13,0,2.07-.16,2.87-.49Zm-49.09-14.77c.94-4.29,2.65-7.68,5.08-10.11,2.79-2.79,6.62-4.15,11.69-4.15,2.54,0,4.77,.42,6.62,1.26,1.84,.83,3.38,1.97,4.58,3.39,1.21,1.44,2.13,3.15,2.72,5.08,.44,1.43,.72,2.95,.85,4.54h-31.54Z' /%3e%3cpath fill='%23fff' d='M681.7,108.6l-.08-.12c-.52-.71-1.01-1.25-1.52-1.65-1.27-.99-3.22-1.16-4.92-.12-.43,.26-.92,.54-1.47,.82-.51,.27-1.13,.53-1.84,.78-.59,.21-1.37,.31-2.34,.31-1.53,0-2.65-.46-3.52-1.45-.91-1.03-1.37-2.55-1.37-4.53V61.69h20.81v-17.34h-20.81V19.45h-11.75c-1.55,0-2.88,.41-3.95,1.23-1.12,.85-1.84,2.04-2.14,3.55l-3.77,20.28-12.99,2.13v9.16c0,1.89,.59,3.37,1.75,4.41,1.1,.98,2.41,1.48,3.92,1.48h6.13v42.28c0,7.3,2.04,13.15,6.07,17.37,4.05,4.25,9.83,6.4,17.17,6.4,4.04,0,8-.63,11.77-1.87,3.81-1.25,7.23-3.13,10.18-5.58l1.26-1.05-6.56-10.64Z' /%3e%3c/g%3e%3cg%3e%3cpath fill='%23fff' d='M255.78,168.38c-.2,.4-.51,.6-.94,.6-.31,0-.72-.18-1.21-.53-.5-.35-1.15-.75-1.96-1.19-.81-.44-1.8-.84-2.98-1.19-1.18-.35-2.62-.53-4.32-.53-1.53,0-2.93,.22-4.19,.66-1.26,.44-2.34,1.03-3.24,1.76-.89,.74-1.59,1.59-2.09,2.57-.5,.98-.75,2-.75,3.08,0,1.33,.34,2.43,1.02,3.31,.68,.88,1.57,1.63,2.68,2.25,1.11,.62,2.36,1.16,3.77,1.61,1.4,.45,2.85,.91,4.32,1.36,1.48,.45,2.92,.96,4.32,1.51,1.4,.55,2.66,1.24,3.77,2.07,1.11,.82,2,1.83,2.68,3.02,.68,1.19,1.02,2.64,1.02,4.34,0,1.85-.33,3.56-1,5.15-.67,1.59-1.63,2.97-2.9,4.13-1.26,1.16-2.82,2.09-4.66,2.77-1.85,.68-3.95,1.02-6.3,1.02-2.98,0-5.55-.48-7.71-1.43-2.16-.95-4.09-2.19-5.79-3.73l.98-1.45c.14-.23,.3-.4,.47-.51,.17-.11,.41-.17,.72-.17,.37,0,.82,.23,1.36,.68s1.24,.94,2.11,1.47c.87,.53,1.94,1.02,3.24,1.47s2.89,.68,4.79,.68c1.79,0,3.36-.25,4.73-.75,1.36-.5,2.5-1.17,3.41-2.02s1.6-1.85,2.07-3,.7-2.36,.7-3.64c0-1.42-.34-2.6-1.02-3.53-.68-.94-1.58-1.73-2.68-2.38-1.11-.65-2.36-1.21-3.77-1.66-1.41-.45-2.85-.91-4.34-1.36s-2.94-.95-4.34-1.49c-1.4-.54-2.66-1.22-3.77-2.04-1.11-.82-2-1.82-2.68-3-.68-1.18-1.02-2.65-1.02-4.41,0-1.5,.33-2.95,.98-4.34,.65-1.39,1.58-2.61,2.79-3.66,1.21-1.05,2.68-1.89,4.41-2.51,1.73-.62,3.68-.94,5.83-.94,2.58,0,4.88,.37,6.88,1.12,2,.75,3.84,1.89,5.51,3.43l-.89,1.41Z' /%3e%3cpath fill='%23fff' d='M306.06,162.42c3.04,0,5.76,.52,8.15,1.55,2.4,1.04,4.42,2.51,6.07,4.41,1.65,1.9,2.9,4.19,3.77,6.88,.87,2.68,1.3,5.68,1.3,9.01s-.43,6.32-1.3,8.98c-.87,2.67-2.12,4.95-3.77,6.86-1.65,1.9-3.67,3.36-6.07,4.39-2.4,1.02-5.12,1.53-8.15,1.53s-5.76-.51-8.15-1.53c-2.4-1.02-4.43-2.48-6.09-4.39-1.66-1.9-2.92-4.19-3.79-6.86-.87-2.67-1.3-5.66-1.3-8.98s.43-6.32,1.3-9.01c.87-2.68,2.13-4.97,3.79-6.88,1.66-1.9,3.69-3.37,6.09-4.41,2.4-1.04,5.12-1.55,8.15-1.55Zm0,40.41c2.53,0,4.73-.43,6.62-1.3,1.89-.87,3.46-2.11,4.73-3.73,1.26-1.62,2.21-3.57,2.83-5.85,.62-2.29,.94-4.85,.94-7.69s-.31-5.37-.94-7.66c-.63-2.3-1.57-4.26-2.83-5.9-1.26-1.63-2.84-2.89-4.73-3.77-1.89-.88-4.1-1.32-6.62-1.32s-4.73,.44-6.62,1.32c-1.89,.88-3.46,2.14-4.73,3.77-1.26,1.63-2.21,3.6-2.85,5.9-.64,2.3-.96,4.85-.96,7.66s.32,5.4,.96,7.69c.64,2.29,1.59,4.24,2.85,5.85,1.26,1.62,2.84,2.86,4.73,3.73,1.89,.87,4.09,1.3,6.62,1.3Z' /%3e%3cpath fill='%23fff' d='M358.95,205.47v-37.94l-5.96-.38c-.82-.06-1.23-.41-1.23-1.06v-1.66h7.2v-5.36c0-2.41,.31-4.54,.94-6.37,.62-1.83,1.5-3.36,2.64-4.58,1.13-1.22,2.5-2.14,4.11-2.75,1.6-.61,3.37-.92,5.3-.92,.88,0,1.77,.08,2.66,.23,.89,.16,1.68,.38,2.36,.66l-.13,1.96c-.03,.4-.3,.6-.81,.6-.34,0-.8-.04-1.38-.13s-1.3-.13-2.15-.13c-1.39,0-2.68,.21-3.85,.62-1.18,.41-2.19,1.07-3.04,1.98s-1.51,2.09-1.98,3.56c-.47,1.46-.7,3.26-.7,5.39v5.24h13.75v3.02h-13.67v38.02h-4.05Z' /%3e%3cpath fill='%23fff' d='M419.75,206.15c-2.87,0-5.1-.79-6.68-2.38-1.59-1.59-2.38-4.04-2.38-7.37v-28.95h-6.09c-.31,0-.57-.09-.77-.26s-.3-.41-.3-.72v-1.58l7.24-.51,1.01-15.16c.03-.25,.13-.48,.32-.68,.18-.2,.43-.3,.74-.3h1.89v16.18h13.33v3.02h-13.33v28.74c0,1.16,.15,2.17,.45,3,.3,.84,.71,1.53,1.23,2.07,.52,.54,1.14,.94,1.85,1.19,.71,.26,1.48,.38,2.3,.38,1.02,0,1.9-.15,2.64-.45,.74-.3,1.38-.62,1.92-.98,.54-.35,.98-.68,1.32-.98,.34-.3,.61-.45,.81-.45,.23,0,.45,.14,.68,.43l1.11,1.79c-1.08,1.19-2.45,2.15-4.11,2.87-1.66,.72-3.38,1.09-5.17,1.09Z' /%3e%3cpath fill='%23fff' d='M453.22,163.1h3.11c.4,0,.72,.11,.98,.32,.26,.21,.43,.45,.51,.7l10.69,33.43c.2,.65,.35,1.28,.47,1.87,.11,.6,.23,1.19,.34,1.79,.14-.6,.3-1.19,.47-1.79,.17-.6,.37-1.22,.6-1.87l11.37-33.72c.2-.62,.6-.94,1.19-.94h1.66c.62,0,1.04,.31,1.23,.94l11.2,33.72c.43,1.28,.77,2.51,1.02,3.7,.11-.6,.23-1.2,.36-1.81,.13-.61,.31-1.24,.53-1.89l10.73-33.43c.23-.68,.71-1.02,1.45-1.02h2.98l-14.18,42.37h-2.98c-.45,0-.78-.3-.98-.89l-11.63-34.4c-.14-.43-.27-.85-.38-1.28-.11-.43-.21-.85-.3-1.28-.09,.43-.18,.85-.28,1.28-.1,.43-.22,.85-.36,1.28l-11.75,34.4c-.17,.6-.51,.89-1.02,.89h-2.85l-14.18-42.37Z' /%3e%3cpath fill='%23fff' d='M568.48,205.47c-.85,0-1.38-.4-1.58-1.19l-.6-5.41c-1.16,1.13-2.32,2.16-3.47,3.07-1.15,.91-2.35,1.67-3.6,2.3-1.25,.62-2.6,1.1-4.05,1.43-1.45,.33-3.04,.49-4.77,.49-1.45,0-2.85-.21-4.22-.64-1.36-.43-2.57-1.08-3.62-1.96-1.05-.88-1.89-2.01-2.53-3.39-.64-1.38-.96-3.03-.96-4.96,0-1.79,.51-3.45,1.53-4.98,1.02-1.53,2.62-2.87,4.79-4,2.17-1.14,4.97-2.04,8.39-2.73,3.42-.68,7.53-1.08,12.33-1.19v-4.43c0-3.92-.84-6.93-2.53-9.05-1.69-2.11-4.19-3.17-7.52-3.17-2.04,0-3.78,.28-5.22,.85-1.43,.57-2.65,1.19-3.64,1.87-.99,.68-1.8,1.31-2.43,1.87-.62,.57-1.15,.85-1.58,.85-.57,0-.99-.25-1.28-.77l-.72-1.23c2.21-2.21,4.54-3.89,6.98-5.02,2.44-1.14,5.21-1.7,8.3-1.7,2.27,0,4.26,.36,5.96,1.09s3.11,1.76,4.24,3.11c1.12,1.35,1.97,2.98,2.53,4.9,.57,1.92,.85,4.05,.85,6.41v27.59h-1.62Zm-17.03-2.26c1.65,0,3.16-.18,4.54-.53,1.38-.35,2.65-.85,3.83-1.49s2.28-1.4,3.3-2.28c1.02-.88,2.03-1.83,3.02-2.85v-11.03c-4.03,.11-7.5,.42-10.41,.92s-5.31,1.17-7.2,2.02-3.28,1.87-4.17,3.04c-.89,1.18-1.34,2.52-1.34,4.02,0,1.42,.23,2.65,.7,3.68,.47,1.04,1.09,1.89,1.85,2.55,.77,.67,1.66,1.16,2.68,1.47,1.02,.31,2.09,.47,3.19,.47Z' /%3e%3cpath fill='%23fff' d='M603.74,205.47v-42.37h2.13c.48,0,.83,.1,1.04,.3,.21,.2,.33,.54,.36,1.02l.34,8.94c1.36-3.43,3.18-6.12,5.45-8.07,2.27-1.94,5.07-2.92,8.39-2.92,1.28,0,2.45,.13,3.53,.4s2.1,.66,3.07,1.17l-.55,2.81c-.09,.45-.37,.68-.85,.68-.17,0-.41-.06-.72-.17-.31-.11-.7-.24-1.17-.38s-1.04-.27-1.72-.38c-.68-.11-1.46-.17-2.34-.17-3.21,0-5.84,.99-7.9,2.98-2.06,1.99-3.73,4.85-5,8.6v27.55h-4.04Z' /%3e%3cpath fill='%23fff' d='M668.25,162.42c2.38,0,4.59,.41,6.62,1.23s3.79,2.02,5.28,3.6c1.49,1.57,2.65,3.51,3.49,5.81,.84,2.3,1.26,4.94,1.26,7.92,0,.63-.09,1.05-.28,1.28s-.47,.34-.87,.34h-30.57v.81c0,3.18,.37,5.98,1.11,8.39,.74,2.41,1.79,4.44,3.15,6.07,1.36,1.63,3.01,2.86,4.94,3.68,1.93,.82,4.09,1.23,6.47,1.23,2.13,0,3.97-.23,5.54-.7s2.87-.99,3.94-1.57c1.06-.58,1.91-1.11,2.53-1.58s1.08-.7,1.36-.7c.37,0,.65,.14,.85,.43l1.11,1.36c-.68,.85-1.58,1.65-2.7,2.38-1.12,.74-2.37,1.37-3.75,1.89s-2.85,.94-4.43,1.26c-1.58,.31-3.16,.47-4.75,.47-2.9,0-5.54-.5-7.92-1.51s-4.43-2.48-6.14-4.41c-1.71-1.93-3.03-4.29-3.96-7.09-.93-2.8-1.4-6-1.4-9.6,0-3.04,.43-5.84,1.3-8.41,.87-2.57,2.11-4.78,3.75-6.64,1.63-1.86,3.63-3.31,6-4.36,2.37-1.05,5.06-1.58,8.07-1.58Zm.06,3.02c-2.18,0-4.14,.34-5.87,1.02-1.73,.68-3.22,1.66-4.49,2.94-1.26,1.28-2.28,2.81-3.06,4.6-.78,1.79-1.3,3.79-1.55,6h27.89c0-2.27-.31-4.31-.93-6.11-.62-1.8-1.5-3.33-2.64-4.58s-2.49-2.21-4.08-2.87c-1.59-.67-3.34-1-5.27-1Z' /%3e%3c/g%3e%3cpath fill='url(%23BLAST)' fill-rule='evenodd' d='M4.12,92.96c-1.43-.39-2.64-1.32-3.38-2.6-.74-1.28-.93-2.8-.55-4.23,.39-1.43,1.32-2.64,2.6-3.38,1.28-.74,2.8-.93,4.23-.55l50.57,13.55h0c3.17,.87,6.52,.91,9.71,.08l.28-.07c3.05-.91,5.82-2.58,8.05-4.86l.02,.02L156.93,9.65c1.05-1.05,2.46-1.63,3.94-1.63s2.9,.59,3.94,1.63c1.05,1.05,1.63,2.46,1.63,3.94s-.59,2.9-1.63,3.94L83.55,98.8v.02c-3.58,3.64-8.06,6.28-12.98,7.69-.13,.04-.25,.08-.38,.12-5.07,1.34-10.4,1.31-15.46-.09h0S4.12,92.96,4.12,92.96Zm18.81-18.77l25.88,6.93c5.06,1.41,10.4,1.43,15.47,.08,5.07-1.36,9.69-4.05,13.37-7.79l33.19-33.19c1.05-1.05,1.64-2.48,1.64-3.96s-.59-2.91-1.64-3.96-2.48-1.64-3.96-1.64-2.91,.59-3.96,1.64l-33.19,33.19c-2.47,2.47-5.32,4.13-8.36,4.95-3.04,.81-6.33,.8-9.69-.1l-25.87-6.93c-.71-.2-1.46-.26-2.2-.17-.74,.09-1.45,.32-2.09,.69-.65,.37-1.21,.86-1.66,1.45-.45,.59-.79,1.26-.98,1.98-.19,.72-.24,1.47-.14,2.2,.1,.74,.35,1.44,.73,2.08,.38,.64,.88,1.2,1.47,1.64,.6,.44,1.27,.76,1.99,.94Zm101.03,124.93l-13.55-50.57c-.88-3.17-.92-6.52-.09-9.7l.07-.29c.9-3.05,2.57-5.83,4.84-8.06L196.5,49.22c1.05-1.05,1.63-2.46,1.63-3.94s-.59-2.9-1.63-3.94c-1.05-1.05-2.46-1.63-3.94-1.63-1.48,0-2.9,.59-3.94,1.63L107.36,122.6c-3.65,3.59-6.3,8.06-7.71,12.97-.04,.13-.08,.25-.12,.38-1.34,5.07-1.31,10.4,.09,15.46h.01l13.56,50.61c.39,1.43,1.32,2.64,2.6,3.38,1.28,.74,2.8,.93,4.23,.55,1.43-.39,2.64-1.32,3.38-2.6,.74-1.28,.93-2.8,.55-4.23h0Zm18.79-18.79l-6.93-25.86c-.88-3.17-.92-6.52-.09-9.71l.07-.28c.91-3.05,2.58-5.82,4.86-8.05l33.2-33.19c1.05-1.05,1.64-2.48,1.64-3.96s-.59-2.91-1.64-3.96c-1.05-1.05-2.48-1.64-3.96-1.64s-2.91,.59-3.96,1.64l-33.18,33.2c-3.64,3.6-6.29,8.07-7.69,12.99-.04,.12-.08,.25-.12,.38-1.34,5.07-1.31,10.4,.09,15.46h.01l6.94,25.9c.19,.71,.52,1.37,.97,1.95,.45,.58,1,1.07,1.64,1.43,.63,.37,1.34,.6,2.06,.7,.73,.09,1.46,.04,2.17-.15,.71-.19,1.37-.52,1.95-.97s1.07-1,1.43-1.64c.36-.63,.6-1.34,.69-2.06,.09-.73,.04-1.46-.15-2.17h0ZM185.84,12.4L16.74,181.48c-1.05,1.05-1.64,2.48-1.64,3.96s.59,2.91,1.64,3.96c1.05,1.05,2.48,1.64,3.96,1.64s2.91-.59,3.96-1.64L193.75,20.31c1.03-1.05,1.6-2.47,1.59-3.94-.01-1.47-.6-2.88-1.64-3.92-1.04-1.04-2.45-1.63-3.92-1.64-1.47-.01-2.89,.56-3.94,1.59ZM51.18,115.37L15.8,150.75c-1.05,1.05-1.64,2.48-1.64,3.96,0,1.49,.59,2.91,1.64,3.96,1.05,1.05,2.48,1.64,3.96,1.64,1.49,0,2.91-.59,3.96-1.64l35.37-35.38c.52-.52,.93-1.14,1.22-1.82,.28-.68,.43-1.41,.43-2.14s-.14-1.47-.43-2.15c-.28-.68-.69-1.3-1.22-1.82-.52-.52-1.14-.93-1.82-1.22-.68-.28-1.41-.43-2.15-.43s-1.47,.15-2.15,.43c-.68,.28-1.3,.7-1.82,1.22v.02Zm31.7,31.68l-35.38,35.39c-1.05,1.05-1.64,2.48-1.64,3.96,0,1.49,.59,2.91,1.64,3.96,1.05,1.05,2.48,1.64,3.96,1.64,1.49,0,2.91-.59,3.96-1.64l35.37-35.39c1.03-1.06,1.6-2.47,1.59-3.94-.01-1.47-.6-2.88-1.64-3.92s-2.45-1.63-3.92-1.64c-1.47,0-2.89,.56-3.94,1.59Z' /%3e%3c/g%3e%3cpath fill='%23fff' d='M679.92,14.02c0-1.29,.17-2.53,.5-3.73,.33-1.19,.8-2.31,1.41-3.35,.61-1.04,1.34-1.98,2.19-2.83,.85-.85,1.8-1.58,2.84-2.19,1.03-.61,2.15-1.08,3.33-1.42,1.19-.33,2.43-.5,3.72-.5s2.53,.17,3.73,.5c1.19,.33,2.31,.8,3.34,1.42,1.04,.61,1.98,1.34,2.84,2.19s1.59,1.79,2.19,2.83c.61,1.04,1.08,2.16,1.41,3.35,.33,1.19,.5,2.44,.5,3.73s-.17,2.51-.5,3.71c-.33,1.19-.8,2.31-1.41,3.34-.61,1.03-1.34,1.98-2.19,2.83-.86,.85-1.8,1.58-2.84,2.19-1.03,.61-2.15,1.09-3.34,1.42-1.2,.33-2.44,.5-3.73,.5s-2.53-.17-3.72-.5c-1.19-.33-2.3-.8-3.33-1.42-1.04-.61-1.98-1.34-2.84-2.19-.86-.85-1.59-1.79-2.19-2.83-.61-1.03-1.08-2.14-1.41-3.33-.33-1.19-.5-2.43-.5-3.72Zm1.92,0c0,1.14,.14,2.23,.42,3.28,.28,1.05,.68,2.03,1.21,2.94,.52,.91,1.15,1.74,1.88,2.48,.73,.74,1.54,1.38,2.43,1.91s1.86,.94,2.89,1.23c1.04,.29,2.11,.43,3.24,.43,1.69,0,3.27-.32,4.74-.96s2.76-1.51,3.85-2.61c1.09-1.1,1.96-2.4,2.59-3.89,.63-1.49,.95-3.09,.95-4.8,0-1.14-.14-2.23-.43-3.29-.29-1.06-.69-2.05-1.22-2.96s-1.15-1.75-1.89-2.5c-.73-.75-1.55-1.39-2.44-1.92-.89-.53-1.86-.94-2.9-1.24-1.04-.29-2.12-.44-3.25-.44-1.69,0-3.26,.32-4.73,.97-1.47,.65-2.75,1.53-3.83,2.64-1.09,1.12-1.94,2.43-2.57,3.93s-.94,3.11-.94,4.82Zm9.31,1.72v6.78h-2.99V5.44h5.52c2.2,0,3.83,.4,4.89,1.2s1.59,1.97,1.59,3.53c0,1.2-.34,2.22-1.03,3.06s-1.7,1.42-3.06,1.74c.22,.13,.41,.29,.57,.48s.31,.42,.45,.67l4.37,6.4h-2.84c-.42,0-.73-.16-.94-.48l-3.85-5.78c-.11-.17-.25-.29-.41-.38-.16-.09-.41-.13-.74-.13h-1.53Zm0-2.18h2.22c.7,0,1.3-.07,1.79-.2,.49-.13,.89-.33,1.19-.58,.3-.26,.52-.57,.65-.94,.13-.37,.2-.8,.2-1.28s-.06-.89-.18-1.25c-.12-.36-.32-.65-.59-.88s-.64-.4-1.08-.52c-.45-.11-1-.17-1.67-.17h-2.53v5.82Z' /%3e%3c/svg%3e)
Auxiliary trace data sets are displayed in a tabular format that presents a list of events contained within the trace. Use PF7 and PF8 to scroll up and down through the list. Use PF10 and PF11 to move left and right through the columns of the display. You can also jump to a particular time period if you know when the problem occurred by overwriting the value above the Time column.
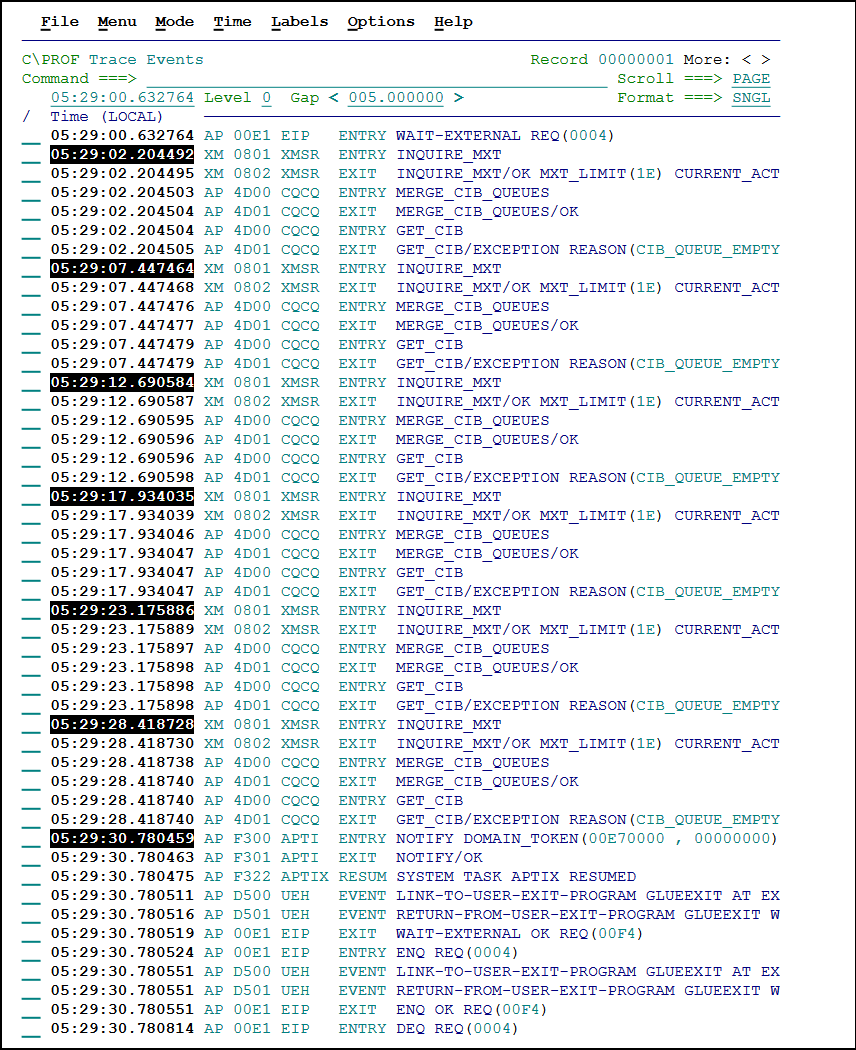 Browsing a list of events in the trace
Navigation and filtering
The following options allow you to navigate, filter and adjust the display to assist in identifying potential problems.
Options used to browse auxiliary trace data sets
| Options | Description |
|---|---|
| Time | Use to jump to a particular time in the trace. To set the desired time, overtype the underlined value above the Time column and then press Enter. The time is specified in hh:mm:ss.ssssss format. |
| Level | Level in conjunction with the FILTER command helps to control which point IDs are included and excluded in the display. Increasing the level increases the amount of filtering that takes place. For additional information, see the FILTER command in Commands. |
| Gap | Use to identify significant time gaps in the trace. Entries that show a jump in time are highlighted. The gap is specified in seconds, fractions of seconds, or both. Examples: Identify gaps of one second: Use 1, 1.0, or 001.000000 Identify gaps of 200 milliseconds: Use .2, 0.2, or 000.200000 Identify gaps of one microsecond: Use 0.000001 (this is the smallest value you may enter) |
| Format | Controls how long lines are displayed on the screen. Format may be one of the following values: SNGL: Display the event on a single line. Scroll right (PF11) to see more of the formatted trace entry. WRAP: Wrap long lines onto the next line. |
Commands
The following commands can be entered on the Command line:
Commands and function keys used to browse the auxiliary trace data set
| Command | Description |
|---|---|
| RESET | Remove outstanding line actions. For a list of line actions, see Line actions. |
| FIND string | Search for a specified character string in the current view. Press the Repeat Find function key (F5) to find the next occurrence. Additional options include: FIND**F string [ NEXT PREV FIRST LAST ] PREFIX SUFFIX WORD** |
| TIME | Set the format of the Time column. The following options are available: TIME W: Wall-clock time. TIME R: Elapsed time relative to the record at the top of the display (base). TIME E: Elapsed time between each record. TIME N: Switch between microsecond and nanosecond precision when displaying relative and elapsed times. Enter TIME without parameters to see additional options. |
| .x | Assign label command. Assign the 1-7 character label x to "remember" the current position in the log file. You can relocate to this position using the LOCATE command. |
| LOCATE | Without parameters, the LOCATE command displays the currently assigned labels. To position the display at a particular label, use LOCATE .x, LOCATE x, or specify the record number using LOCATE n. |
| LABELS | Controls the display of labels. The following options are available: LABELS ON: Shows all assigned labels LABELS OFF: Hides all labels from the display LABELS RESET: Removes all labels. |
| TIMEOUT | Set a time limit on delays caused by long data set scans caused by filtering, scrolling, or FIND commands. When the timeout value (in seconds) is reached, control is returned back to the terminal and the file position is updated to where the scan was interrupted. |
| FINDLIM n | Set the maximum number of records to process when using primary commands FIND and line actions TX and TU. The Repeat Find function key (F5) recommences the search from the start of the next block of records. |
| FILTER | Filter by point ID. Use FILTER in conjunction with the Level field to control which point IDs are included and excluded in the display. Increasing the level increases the amount of filtering that takes place. See the example below. |
FILTER example
Consider the following filter:
Exc  Level  Point IDs
  *     0    DD *      MN *      SM *     ...Always excluded
        1    XM 1102                      ...Task attach
        2    XS 070A   AP 0741            ...Security/abend
        3    AP 0500   PG 1101            ...Program load
        4    AP E160   AP E161            ...EXEC CICS
        5    AP 3250   AP 3251   AP 3281  ...DB2 SQL
        5    AP A090   AP A091            ...IBM MQ
        5    AP 0328   AP 0329   AP 0311  ...IMS DLI
        5    AP 21E0                      ...JCICS
With this filter in place, the following point IDs are displayed for the specified Level:
- Level 0: All point IDs except for the DD, MN and SM domains
- Level 1: Task attach events only
- Level 2: Security, abend and level 1
- Level 3: Program load and levels 1 and 2
- Level 4: EXEC CICS and levels 1, 2 and 3
- Level 5: DB2, MQ, IMS, JCICS and levels 1, 2, 3 and 4
Function keys
The following function keys are available in the trace viewer. Function keys available in the trace viewer
| Function key | Description |
|---|---|
| F1 | Access online help |
| F3 | Exit |
| F4 | Switch between Formatted mode, and ISPF Browse mode. You can also switch mode by selecting Mode in the action bar. |
| F5 | Repeat the last FIND command. |
| F6 | Alternate between displaying the CICS Region and Task number columns, and the Time column. |
| F7 | Scroll up. |
| F8 | Scroll down. |
| F10 | Scroll left. |
| F11 | Scroll right. |
| F12 | Cancel. |
Line actions
The following line actions may be entered next to an event in the trace.
Controlling the time
Line actions used to control the time display in the C\Prof trace viewer
| Line action | Description |
|---|---|
| W | Display wall-clock time. |
| R | Display relative times. For each record this is the elapsed time from the selected baseline record. |
| E | Display the elapsed time between each record. |
| N | Switch to nanosecond precision. Use N again to switch back to microsecond precision. Display relative or elapsed time in nanosecond precision. |
| T | Reset the display to position the selected record at the top of the display. |
Filtering and level options
The following line actions filter the display to include required trace entries only. You can filter by domain or by individual point IDs. Use the FILTER command to view and edit the current filter settings.
Line actions used for filtering and level display in the C\Prof trace viewer
| Line action | Description |
|---|---|
| I | Only include this point ID in the display. |
| ID | Include all point IDs for this domain in the display. |
| X | Exclude this point ID from the display. |
| XD | Exclude all point IDs for this domain from the display. |
Additional options
Additional line actions used to analyze an auxiliary trace data set
| Line action | Description |
|---|---|
| / | Display the selection list of valid line actions. |
| S | Display the formatted record. Formatted records can be displayed in standard format (STD) or dump format (DUMP). Press PF4 to switch between the two formats. |
| L | Assign a label to a record. Labels have the format .Znnnnnn and are assigned sequentially from .Z000000 to .Z999999. |
| TX | Track the transaction. Show only entries with the same task number. Enter the RESET command to stop tracking and restore records that were excluded from the transaction. See also the FINDLIM command. |