Enhance CICS performance Monitoring with Rocket C\Prof: Issue Resolution (Part 3)
May 1, 2023
This blog post is part of a series on enhancing CICS performance monitoring with Rocket C\Prof. Rocket Software’s IBM CICS transaction profiling solution complements established mainframe CICS performance monitoring solutions like Rocket TMON for CICS TS and Rocket TMON PA—part of the Rocket TMON ONE family—as well as IBM OMEGAMON for CICS and IBM CICS Performance Analyzer (CICS PA).
In our last post, we covered the importance of confirming CICS performance problems with these tools, the second step of three when considering how to address CICS issues:
- Detect any potential issues.
- Confirm their existence.
- Take the necessary steps to resolve them.
In this post, we will explore how to take the necessary steps to resolve CICS issues after identifying and confirming potential issues.
CICS Issue Resolution
After detecting and confirming a problem in a CICS system, the next step is to resolve it. Usually, CICS issues are related to specific applications, so the quickest way to solve the problem is to identify the application causing it.
C\Prof provides detailed application-level insights into transactions running on CICS systems. It helps users identify the applications causing performance issues and take the necessary actions to resolve them.
C\Prof generates reports based on information collected through a diagnostic feature in CICS, known as “CICS trace.” A CICS trace is like an application trail. It provides a detailed history of how a CICS transaction is processed, allowing experts to analyze the transaction microscopically. When the CICS trace feature is turned on for a transaction, CICS records many details about the transaction, such as which programs were used, what resources were accessed, what data was processed, and when events occurred.
This is what a CICS trace looks like:
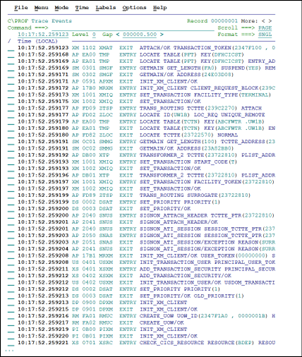
As the above illustrates, without CICS expertise it is very hard to solve a problem looking at the data in this format. With C\Prof it’s possible to analyze performance data without being a CICS expert. C\Prof first provides a summary list of all transactions in, or across, regions.
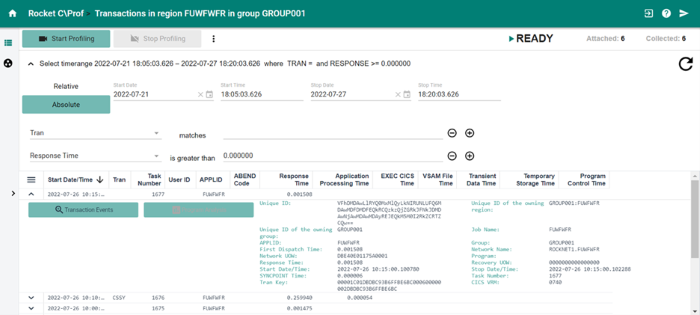
Users can filter and sort this list and customize the columns that are displayed. Next, they can drill down into any of the transactions in the list to see the events in the life of the transaction.
For instance, in the following example, we can see the various program calls that are executed as a transaction proceeds. The time taken by each command, the resource used, and the response code of the last command are also shown in a way that is easily understandable to an average user.
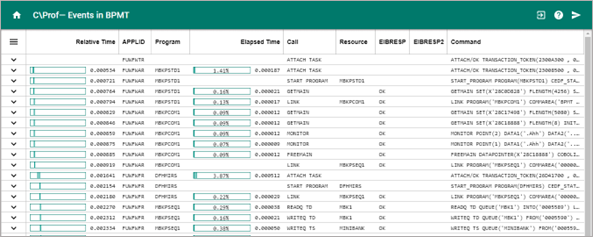
Often, this level of detail is sufficient to debug a problem. However, if needed, users can drill down further into any event and view the corresponding call statements in an easy-to-understand format.
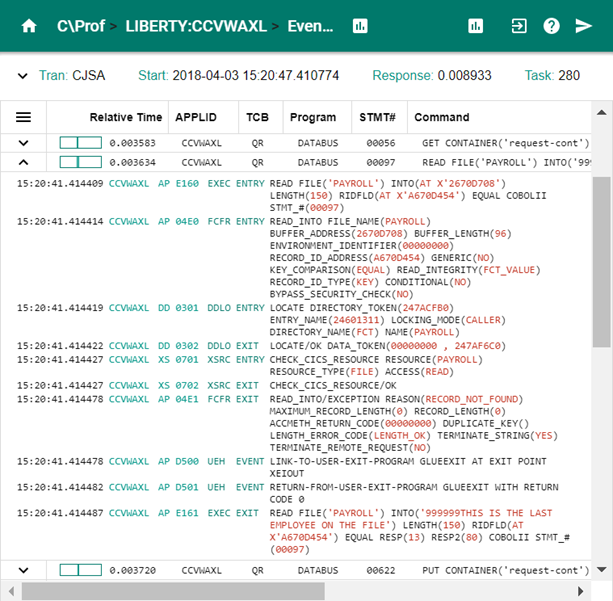
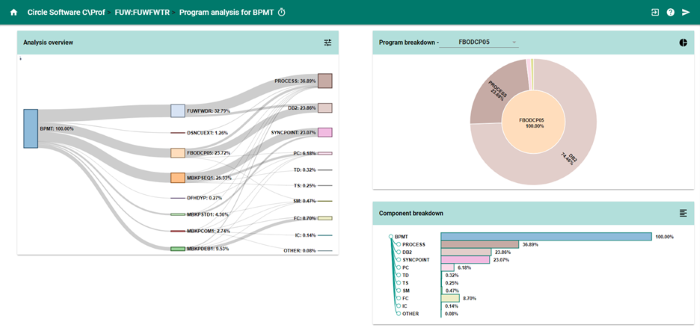
Besides columnar formats, C\Prof also provides graphical summaries of transaction data through a web-based user interface.
The Importance of Graphical UIs for CICS
Through these graphical visualizations, we can see how much processing time each application takes as a proportion of the overall transaction time. Users can drill down further within each application to see how much time it needs to execute its own code and how much time it spends triggering other components, such as document handler, message handler, and storage manager, or database systems. C\Prof will slice and dice this information in various ways.
C\Prof collects this information across multiple CICS regions, allowing users to track transactions as they move through different regions. With this data, users can forensically analyze an application to determine which program and statement is causing performance issues.
Make CICS Performance Easier
The key benefit of using C\Prof is that it doesn’t require CICS expertise to understand performance issues. C\Prof summarizes the granular data provided in a CICS trace into higher level application events such as a command, which a support engineer with experience in COBOL or Job Control Language (JCL) can usually understand.
C\Prof is a lightweight, low overhead solution. It operates outside of CICS and requires no changes to CICS itself—no exits, agents, or resource definitions. CICS is unaware of C\Prof activity and is completely unaffected by it. When using C\Prof it quietly triggers what it calls a “collection task,” which works in the background capturing CICS internal trace records. The benefit of this approach is that there is no additional overhead in the CICS environment—other than having trace enabled—to collect the data. This means that C\Prof can be used in production systems without impacting performance.
IBM and Rocket Software provide a comprehensive set of tools to identify, confirm, and resolve issues in the CICS environment.
Rocket TMON for CICS TS and OMEGAMON for CICS offers real-time monitoring and detailed information about individual CICS regions, while Rocket TMON PA and CICS PA can confirm issues detected by the monitor and generate reports that identify trends.
Rocket C\Prof provides detailed insights into CICS applications, enabling users to diagnose problems at the application level without being a CICS expert. Due to its efficiency, usability, and relative simplicity, C\Prof is an essential component of any organization's plan to modernize their mainframe infrastructure.
Read the first and second installments of this blog series for more. To learn about how C\Prof can be used for problem analysis and performance tuning, watch this engaging video, Problem Analysis and Performance Tuning for CICS with Rocket C\Prof, or visit the Rocket® C\Prof page.


