What's New
Key highlights for this new release include:
- Live dashboards
- Self-service user interface
- Flexibility to match the way you work
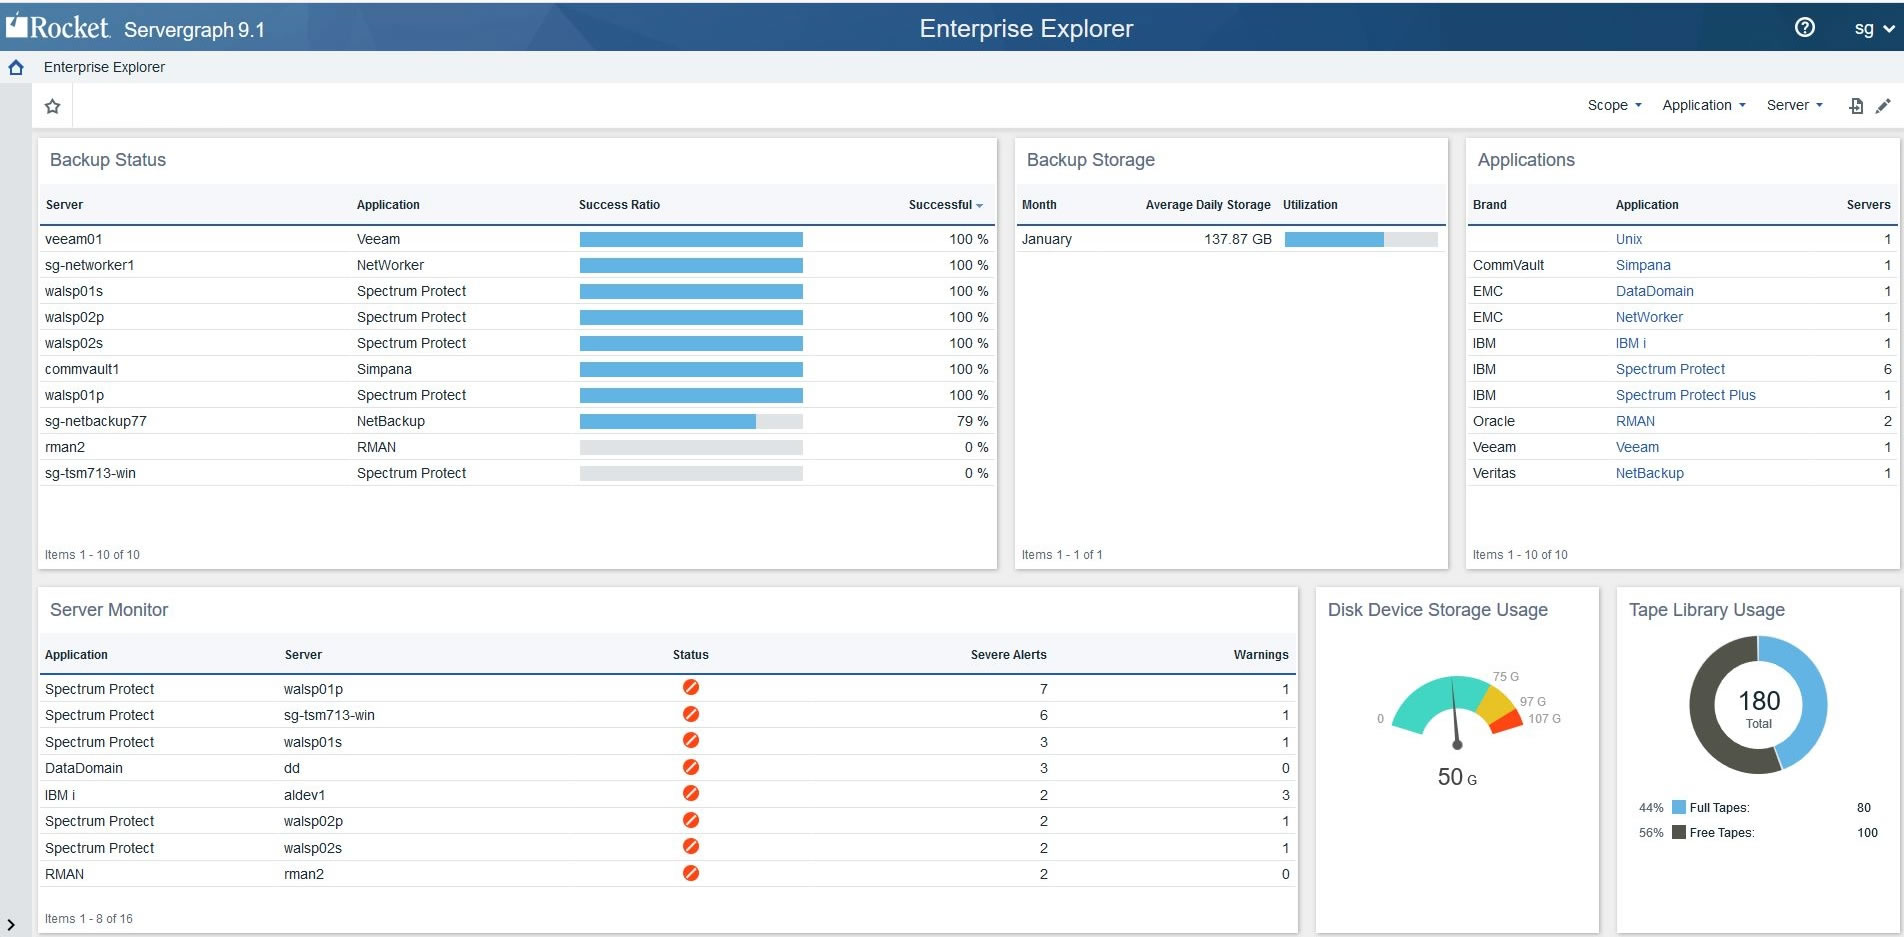
Create live dashboards in minutes, instead of spending hours building reports
The new dashboard UI makes it easier and faster to create and modify dashboards, freeing up your time to work on more business-critical tasks. It only takes a few clicks to tailor dashboards to your users and the information they need. Drag and drop to create graphs and tables. Create widgets to include additional information.
IT teams can significantly reduce response times to user requests and audit requirements by building on-demand dashboards, virtually eliminating the time it takes to build time-consuming monthly batch reports for each stakeholder. If any additional data points are needed, simply update the dashboard or create a new one in minutes.
Empower your users through a simple, easy-to-use user interface
In many environments, users are dependent on IT to make changes to existing reports, sometimes waiting weeks for the new information. With a distributed dashboard environment that’s simple to use and customize, a user can bypass IT and create it him or herself. The result is a happier user who gets what he or she wants faster, and a reduction in the number of requests submitted to the admin team.
Users can simply click on dashboard data to see an expanded overview of all data points. Drill down for more detail on everything from server backup status to which servers and clients are growing the fastest–then easily click back into the dashboard for a higher-level view.

