Rocket MultiValue Performance Experience | It's Happening! Are You Ready?
November 9, 2021
If you’re running Rocket UniVerse and looking for a better system monitoring tool, your wait is almost over. The Rocket MultiValue R&D team has been hard at work on a new product, the Rocket MultiValue Performance Experience (MV Performance Experience).
What is it?
MV Performance Experience is a system monitoring tool for UniVerse enabling you to understand and enhance UniVerse performance. MV Performance Experience helps you identify and escalate MV Application Server-specific performance-impacting events. Escalated events also include possible resolutions, allowing you to easily track the source of the issue and address it. In addition to an Events monitoring tile, MV Performance Experience includes other monitoring tiles that actively monitor issues with Sessions and Locks plus the ability to dive deep into specific Process IDs (PIDs).
Tell me more about what will it do?
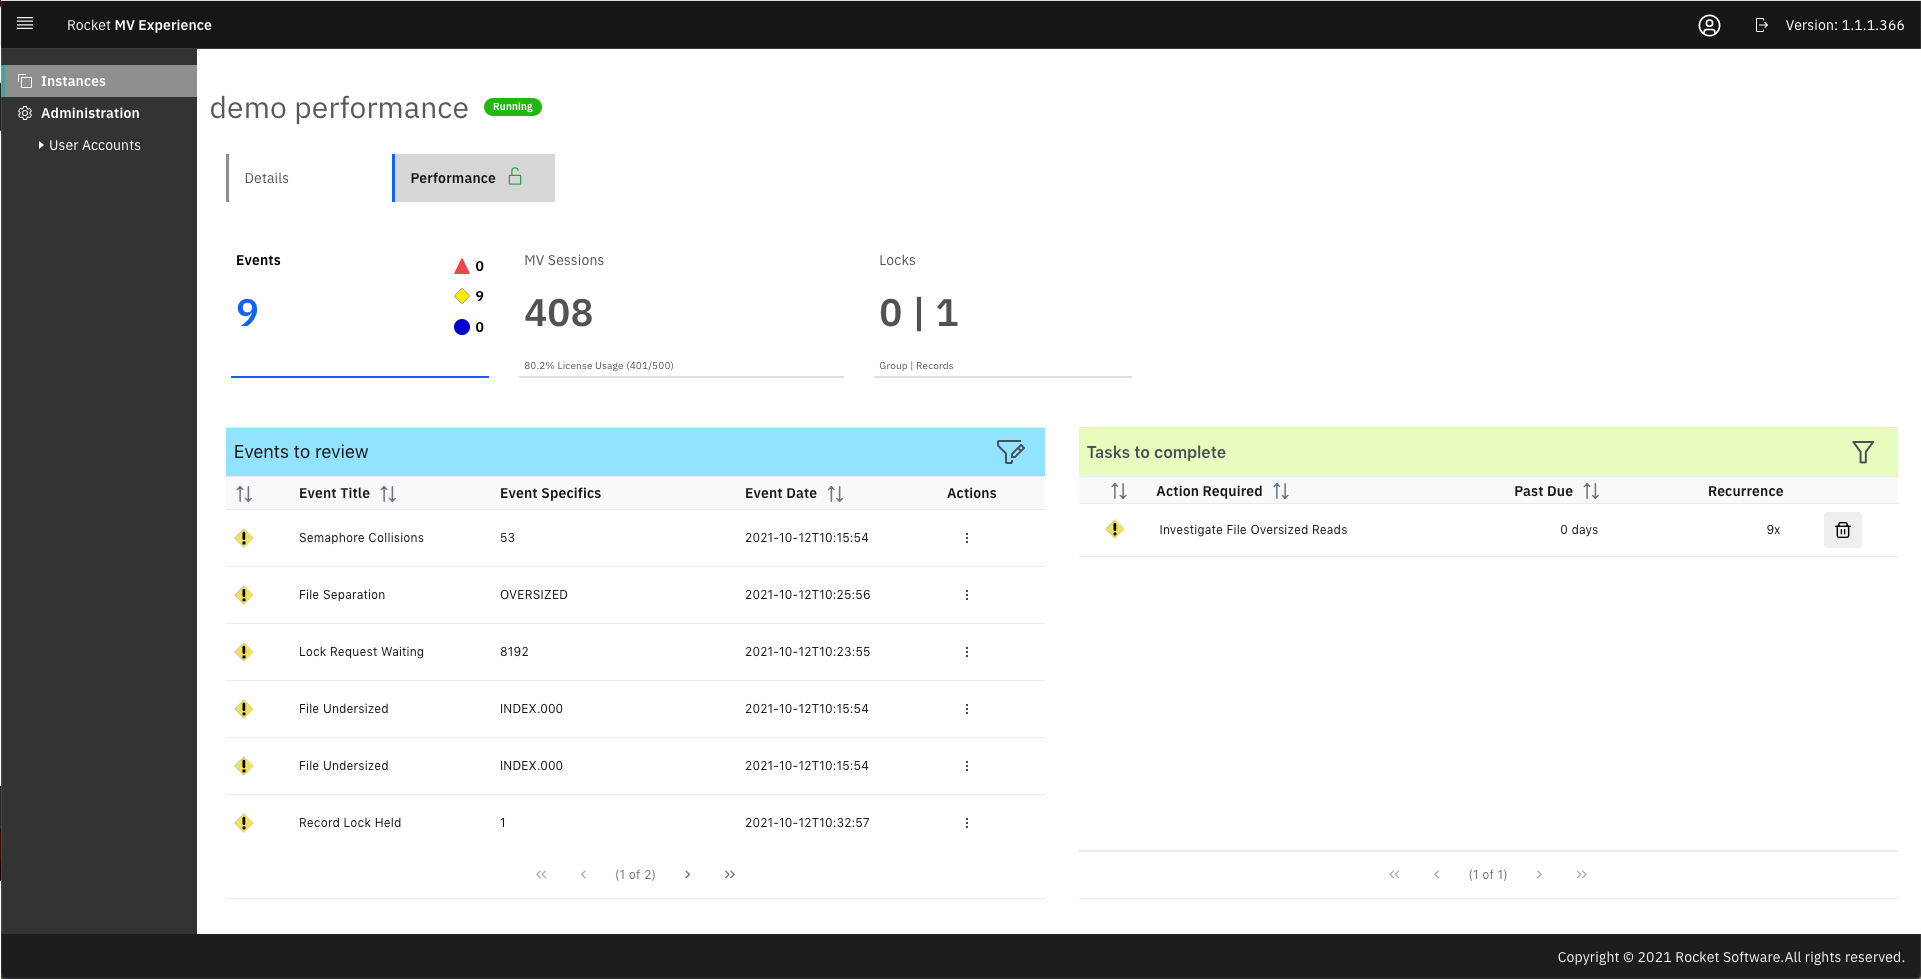
At launch, MV Performance Experience v 1.1.1 will include three monitoring tiles; we’re planning additional tiles in future releases.
1) Events
For a registered instance of UniVerse, the Events tile monitors over 20 MVAS-specific events that could impact performance. You can configure this tile according to the usage profile of your server. You can also change the threshold of event triggers across a server in the MV Performance Experience dashboard. The current list of events is very specific to UniVerse; these events are inaccessible by other 3rd party systems.
MV Performance Experience not only escalates an event that’s impacting performance of UniVerse, but it also provides guidance on how to address the escalated issue. To help with next steps MV Performance Experience takes a snapshot of key data parameters when the event triggered, to help in root cause analysis. Additionally, these events can quickly be converted to tasks that you can address later or assign to others on the team.
You can also enter you own solution in the case our guidance didn’t solve the problem. Rocket R&D will analyze this user-provided information in future versions of MV Performance Experience to build ML/AI and improve our overall guidance to users when addressing issues.
2) MV Sessions
The MV Sessions monitoring tile informs on the active number of users logged into the registered UniVerse instance and their license consumption. By showing users vs. license usage on the server, it is easy to see if the system is overwhelmed.
Drilling into the MV Sessions tile, you get a more in-depth view of the specific Process IDs (PID) that have been running on the system. In addition to showing how long the process have been running, you can drill down even further to understand consumption across key performance tracking parameters such as memory, CPU usage, File/Record locks, PORTSTATUS output, etc. for that specific PID.
The MV Sessions monitoring tile also charts peak license usage which you can pivot over time (the last 7 days, the last month, the last 3 months, etc.).
3) Locks
The Locks monitoring tile provides insight into the current group and record locks being applied on the system.
By drilling into the Locks tile, you’ll gain additional insight into the specific locks that have been applied. One table displays information related to Record and File locks so you can determine if the locks need to be released, what process and who’s holding the lock, how long the lock has been held, and how many additional processes are waiting on it. If you want similar information for Group locks, simply look at the Group Locks table.
Interested in trends? The Locks tile shows trends related to the types and numbers of locks being held over time, so you can easily identify abnormal activity on the server.
Agile development and how MV Performance Experience will evolve and be released over time
The value of these monitoring tiles and the drill through experiences the tiles provide were improved and refined by feedback from our early adopters during the first alpha. We will continue to pre-release test with our early adopters as they give us feedback and direction. As a result, in following Agile development practices, value and sometimes what you see (demos, snapshots, roadmaps) will very likely continue evolving at every release. While changes may seem jarring at times, it will ensure that we deliver a more valuable product with the best user experience to you, our customers.
How much will it cost?
For our UniVerse 11.3.4 customers with an active maintenance agreement, MV Performance Experience is available at no additional charge. In other words, yes, it’s free.
When can I have it?
Our goal is to provide value and to provide a reliable, stable product. Our plan is to release MV Performance Experience v 1.1.1 in December 2021. Rocket is also taking a very agile approach and considering input from customers though our early adopter programs (Alphas/ Betas). Based on customer input and need, we plan to continually add value and plan to introduce additional tiles to monitor Replication, File Health, and CPU/Memory.
Pre-order MV Performance Experience
If you’re on UniVerse 11.3.4, a maintenance release which works with MV Performance Experience, and current on your maintenance contract, it’s free. Sign up today and we’ll notify you as soon as it’s ready for download from RBC. If you’re on an older version of UniVerse, be sure to upgrade soon!


