 scale(1 -1)' gradientUnits='userSpaceOnUse'%3e%3cstop offset='0' stop-color='%23d257fc' /%3e%3cstop offset='.15' stop-color='%23b62dcc' /%3e%3cstop offset='.32' stop-color='%23909' /%3e%3cstop offset='.44' stop-color='%238312b6' /%3e%3cstop offset='.76' stop-color='%23503eff' /%3e%3c/linearGradient%3e%3c/defs%3e%3cg%3e%3cg%3e%3cpath fill='%23fff' d='M288.22,77.61c2.7-1.09,5.19-2.4,7.44-3.91,3.22-2.16,5.96-4.72,8.15-7.59,2.2-2.88,3.9-6.12,5.07-9.65,1.16-3.52,1.75-7.29,1.75-11.23,0-4.95-.86-9.56-2.57-13.71-1.73-4.21-4.49-7.87-8.18-10.88-3.65-2.97-8.36-5.31-14-6.94-5.57-1.61-12.32-2.43-20.06-2.43h-35.88V126.51h24.51v-43.55h6.98c2.15,0,3.24,.34,3.77,.62,.77,.41,1.51,1.16,2.21,2.23l23.43,35.68c1.03,1.58,2.33,2.83,3.84,3.69,1.54,.88,3.4,1.33,5.52,1.33h22.21l-29.9-44.11c-1.27-1.85-2.7-3.45-4.28-4.78Zm-33.77-46.52h11.37c7.17,0,12.52,1.39,15.88,4.12,3.29,2.68,4.89,6.46,4.89,11.56,0,2.58-.42,4.97-1.26,7.1-.81,2.08-2.07,3.91-3.72,5.42-1.67,1.53-3.86,2.76-6.49,3.65-2.69,.91-5.93,1.37-9.61,1.37h-11.06V31.09Z' /%3e%3cpath fill='%23fff' d='M386.19,53.94c-3.56-3.67-7.92-6.54-12.95-8.53-5.01-1.98-10.65-2.98-16.76-2.98s-11.77,1-16.8,2.98c-5.06,1.99-9.44,4.86-13.03,8.53-3.59,3.67-6.4,8.19-8.36,13.45-1.95,5.22-2.93,11.12-2.93,17.54s.99,12.39,2.93,17.61c1.96,5.26,4.77,9.81,8.35,13.52,3.59,3.73,7.98,6.63,13.04,8.62,5.03,1.98,10.68,2.98,16.8,2.98s11.76-1,16.76-2.98c5.04-1.99,9.4-4.89,12.96-8.62,3.56-3.72,6.34-8.27,8.27-13.53,1.92-5.22,2.89-11.14,2.89-17.61s-.97-12.31-2.89-17.53c-1.93-5.26-4.72-9.79-8.28-13.46Zm-16.65,49.47c-2.81,3.93-7.08,5.84-13.07,5.84s-10.43-1.92-13.27-5.88c-2.94-4.1-4.43-10.25-4.43-18.29s1.49-14.22,4.43-18.37c2.84-4,7.17-5.95,13.26-5.95s10.26,1.93,13.07,5.91c2.91,4.12,4.39,10.32,4.39,18.41s-1.48,14.25-4.39,18.33Z' /%3e%3cpath fill='%23fff' d='M462.91,102.23c-1.61,0-3.07,.51-4.36,1.52-.94,.74-2.04,1.54-3.27,2.41-1.16,.81-2.62,1.57-4.36,2.26-1.64,.65-3.89,.98-6.66,.98s-5.21-.52-7.36-1.55c-2.13-1.02-3.97-2.54-5.48-4.52-1.54-2.03-2.75-4.6-3.58-7.64-.85-3.11-1.28-6.73-1.28-10.75s.39-7.4,1.17-10.44c.76-2.96,1.91-5.5,3.43-7.56,1.47-2,3.35-3.55,5.58-4.62,2.25-1.08,4.93-1.63,7.97-1.63,2.4,0,4.42,.27,5.99,.79,1.64,.55,3.07,1.17,4.24,1.85,1.26,.73,2.35,1.39,3.25,1.96,1.23,.78,2.53,1.18,3.87,1.18,1.45,0,2.62-.34,3.49-1,.67-.51,1.33-1.18,2-2.03l6-8.3-1.14-1.14c-3.7-3.7-7.93-6.58-12.58-8.57-4.66-1.99-10.14-3-16.27-3-6.44,0-12.25,1.09-17.24,3.24-5.01,2.15-9.28,5.18-12.69,8.99-3.39,3.8-6,8.35-7.74,13.53-1.73,5.13-2.6,10.76-2.6,16.75,0,6.67,.99,12.71,2.93,17.96,1.95,5.27,4.65,9.8,8.01,13.45,3.38,3.68,7.4,6.52,11.95,8.44,4.53,1.91,9.42,2.88,14.53,2.88,2.85,0,5.77-.21,8.67-.64,2.95-.43,5.85-1.18,8.6-2.22,2.77-1.05,5.48-2.47,8.06-4.21,2.59-1.75,5.03-3.96,7.24-6.54l1.01-1.18-6.38-8.09c-1.12-1.67-2.85-2.55-5-2.55Z' /%3e%3cpath fill='%23fff' d='M529.12,81.74c-.39-.49-.81-.96-1.26-1.4,.43-.35,.85-.73,1.25-1.12,.97-.94,1.92-1.99,2.83-3.11l27.18-32.46h-21.46c-1.93,0-3.56,.39-4.83,1.16-1.15,.69-2.23,1.64-3.26,2.85l-19.63,24.25c-.81,.97-1.38,1.37-1.71,1.53-.25,.13-.87,.34-2.16,.34h-1.66V8.2h-22.81V126.51h22.81v-36.23h2.43c1.65,0,2.38,.23,2.67,.36,.25,.12,.78,.48,1.55,1.65l20.11,29.98c1,1.51,2.18,2.6,3.5,3.26,1.29,.64,2.84,.97,4.62,.97h20.77l-28.4-41.35c-.84-1.21-1.69-2.35-2.54-3.41Z' /%3e%3cpath fill='%23fff' d='M625.48,88.87c.94-.38,1.69-1.03,2.24-1.91,.48-.77,.79-1.75,.96-2.98,.14-1.04,.21-2.33,.21-3.84,0-5.91-.9-11.26-2.67-15.89-1.78-4.67-4.31-8.68-7.51-11.91-3.21-3.24-7.08-5.73-11.5-7.41-4.39-1.67-9.24-2.51-14.43-2.51-6.14,0-11.75,1.09-16.67,3.24-4.92,2.15-9.15,5.11-12.57,8.81-3.42,3.69-6.08,8.07-7.9,13.04-1.82,4.94-2.74,10.28-2.74,15.87,0,7.14,1.05,13.52,3.13,18.98,2.09,5.49,5,10.17,8.66,13.91,3.67,3.75,8.04,6.62,13,8.53,4.92,1.9,10.31,2.86,16.02,2.86,2.85,0,5.83-.21,8.85-.63,3.07-.43,6.12-1.17,9.07-2.21,2.98-1.05,5.87-2.46,8.6-4.2,2.76-1.76,5.29-3.97,7.51-6.57l1.01-1.19-6.47-8.09c-.58-.79-1.28-1.41-2.09-1.85-.84-.46-1.82-.69-2.91-.69-1.51,0-3.05,.45-4.6,1.33-1.23,.7-2.68,1.49-4.33,2.35-1.57,.82-3.44,1.58-5.56,2.27-2.03,.66-4.52,.99-7.4,.99-5.8,0-10.31-1.68-13.77-5.15-3.14-3.14-5.1-8.07-5.82-14.66h46.8c1.13,0,2.07-.16,2.87-.49Zm-49.09-14.77c.94-4.29,2.65-7.68,5.08-10.11,2.79-2.79,6.62-4.15,11.69-4.15,2.54,0,4.77,.42,6.62,1.26,1.84,.83,3.38,1.97,4.58,3.39,1.21,1.44,2.13,3.15,2.72,5.08,.44,1.43,.72,2.95,.85,4.54h-31.54Z' /%3e%3cpath fill='%23fff' d='M681.7,108.6l-.08-.12c-.52-.71-1.01-1.25-1.52-1.65-1.27-.99-3.22-1.16-4.92-.12-.43,.26-.92,.54-1.47,.82-.51,.27-1.13,.53-1.84,.78-.59,.21-1.37,.31-2.34,.31-1.53,0-2.65-.46-3.52-1.45-.91-1.03-1.37-2.55-1.37-4.53V61.69h20.81v-17.34h-20.81V19.45h-11.75c-1.55,0-2.88,.41-3.95,1.23-1.12,.85-1.84,2.04-2.14,3.55l-3.77,20.28-12.99,2.13v9.16c0,1.89,.59,3.37,1.75,4.41,1.1,.98,2.41,1.48,3.92,1.48h6.13v42.28c0,7.3,2.04,13.15,6.07,17.37,4.05,4.25,9.83,6.4,17.17,6.4,4.04,0,8-.63,11.77-1.87,3.81-1.25,7.23-3.13,10.18-5.58l1.26-1.05-6.56-10.64Z' /%3e%3c/g%3e%3cg%3e%3cpath fill='%23fff' d='M255.78,168.38c-.2,.4-.51,.6-.94,.6-.31,0-.72-.18-1.21-.53-.5-.35-1.15-.75-1.96-1.19-.81-.44-1.8-.84-2.98-1.19-1.18-.35-2.62-.53-4.32-.53-1.53,0-2.93,.22-4.19,.66-1.26,.44-2.34,1.03-3.24,1.76-.89,.74-1.59,1.59-2.09,2.57-.5,.98-.75,2-.75,3.08,0,1.33,.34,2.43,1.02,3.31,.68,.88,1.57,1.63,2.68,2.25,1.11,.62,2.36,1.16,3.77,1.61,1.4,.45,2.85,.91,4.32,1.36,1.48,.45,2.92,.96,4.32,1.51,1.4,.55,2.66,1.24,3.77,2.07,1.11,.82,2,1.83,2.68,3.02,.68,1.19,1.02,2.64,1.02,4.34,0,1.85-.33,3.56-1,5.15-.67,1.59-1.63,2.97-2.9,4.13-1.26,1.16-2.82,2.09-4.66,2.77-1.85,.68-3.95,1.02-6.3,1.02-2.98,0-5.55-.48-7.71-1.43-2.16-.95-4.09-2.19-5.79-3.73l.98-1.45c.14-.23,.3-.4,.47-.51,.17-.11,.41-.17,.72-.17,.37,0,.82,.23,1.36,.68s1.24,.94,2.11,1.47c.87,.53,1.94,1.02,3.24,1.47s2.89,.68,4.79,.68c1.79,0,3.36-.25,4.73-.75,1.36-.5,2.5-1.17,3.41-2.02s1.6-1.85,2.07-3,.7-2.36,.7-3.64c0-1.42-.34-2.6-1.02-3.53-.68-.94-1.58-1.73-2.68-2.38-1.11-.65-2.36-1.21-3.77-1.66-1.41-.45-2.85-.91-4.34-1.36s-2.94-.95-4.34-1.49c-1.4-.54-2.66-1.22-3.77-2.04-1.11-.82-2-1.82-2.68-3-.68-1.18-1.02-2.65-1.02-4.41,0-1.5,.33-2.95,.98-4.34,.65-1.39,1.58-2.61,2.79-3.66,1.21-1.05,2.68-1.89,4.41-2.51,1.73-.62,3.68-.94,5.83-.94,2.58,0,4.88,.37,6.88,1.12,2,.75,3.84,1.89,5.51,3.43l-.89,1.41Z' /%3e%3cpath fill='%23fff' d='M306.06,162.42c3.04,0,5.76,.52,8.15,1.55,2.4,1.04,4.42,2.51,6.07,4.41,1.65,1.9,2.9,4.19,3.77,6.88,.87,2.68,1.3,5.68,1.3,9.01s-.43,6.32-1.3,8.98c-.87,2.67-2.12,4.95-3.77,6.86-1.65,1.9-3.67,3.36-6.07,4.39-2.4,1.02-5.12,1.53-8.15,1.53s-5.76-.51-8.15-1.53c-2.4-1.02-4.43-2.48-6.09-4.39-1.66-1.9-2.92-4.19-3.79-6.86-.87-2.67-1.3-5.66-1.3-8.98s.43-6.32,1.3-9.01c.87-2.68,2.13-4.97,3.79-6.88,1.66-1.9,3.69-3.37,6.09-4.41,2.4-1.04,5.12-1.55,8.15-1.55Zm0,40.41c2.53,0,4.73-.43,6.62-1.3,1.89-.87,3.46-2.11,4.73-3.73,1.26-1.62,2.21-3.57,2.83-5.85,.62-2.29,.94-4.85,.94-7.69s-.31-5.37-.94-7.66c-.63-2.3-1.57-4.26-2.83-5.9-1.26-1.63-2.84-2.89-4.73-3.77-1.89-.88-4.1-1.32-6.62-1.32s-4.73,.44-6.62,1.32c-1.89,.88-3.46,2.14-4.73,3.77-1.26,1.63-2.21,3.6-2.85,5.9-.64,2.3-.96,4.85-.96,7.66s.32,5.4,.96,7.69c.64,2.29,1.59,4.24,2.85,5.85,1.26,1.62,2.84,2.86,4.73,3.73,1.89,.87,4.09,1.3,6.62,1.3Z' /%3e%3cpath fill='%23fff' d='M358.95,205.47v-37.94l-5.96-.38c-.82-.06-1.23-.41-1.23-1.06v-1.66h7.2v-5.36c0-2.41,.31-4.54,.94-6.37,.62-1.83,1.5-3.36,2.64-4.58,1.13-1.22,2.5-2.14,4.11-2.75,1.6-.61,3.37-.92,5.3-.92,.88,0,1.77,.08,2.66,.23,.89,.16,1.68,.38,2.36,.66l-.13,1.96c-.03,.4-.3,.6-.81,.6-.34,0-.8-.04-1.38-.13s-1.3-.13-2.15-.13c-1.39,0-2.68,.21-3.85,.62-1.18,.41-2.19,1.07-3.04,1.98s-1.51,2.09-1.98,3.56c-.47,1.46-.7,3.26-.7,5.39v5.24h13.75v3.02h-13.67v38.02h-4.05Z' /%3e%3cpath fill='%23fff' d='M419.75,206.15c-2.87,0-5.1-.79-6.68-2.38-1.59-1.59-2.38-4.04-2.38-7.37v-28.95h-6.09c-.31,0-.57-.09-.77-.26s-.3-.41-.3-.72v-1.58l7.24-.51,1.01-15.16c.03-.25,.13-.48,.32-.68,.18-.2,.43-.3,.74-.3h1.89v16.18h13.33v3.02h-13.33v28.74c0,1.16,.15,2.17,.45,3,.3,.84,.71,1.53,1.23,2.07,.52,.54,1.14,.94,1.85,1.19,.71,.26,1.48,.38,2.3,.38,1.02,0,1.9-.15,2.64-.45,.74-.3,1.38-.62,1.92-.98,.54-.35,.98-.68,1.32-.98,.34-.3,.61-.45,.81-.45,.23,0,.45,.14,.68,.43l1.11,1.79c-1.08,1.19-2.45,2.15-4.11,2.87-1.66,.72-3.38,1.09-5.17,1.09Z' /%3e%3cpath fill='%23fff' d='M453.22,163.1h3.11c.4,0,.72,.11,.98,.32,.26,.21,.43,.45,.51,.7l10.69,33.43c.2,.65,.35,1.28,.47,1.87,.11,.6,.23,1.19,.34,1.79,.14-.6,.3-1.19,.47-1.79,.17-.6,.37-1.22,.6-1.87l11.37-33.72c.2-.62,.6-.94,1.19-.94h1.66c.62,0,1.04,.31,1.23,.94l11.2,33.72c.43,1.28,.77,2.51,1.02,3.7,.11-.6,.23-1.2,.36-1.81,.13-.61,.31-1.24,.53-1.89l10.73-33.43c.23-.68,.71-1.02,1.45-1.02h2.98l-14.18,42.37h-2.98c-.45,0-.78-.3-.98-.89l-11.63-34.4c-.14-.43-.27-.85-.38-1.28-.11-.43-.21-.85-.3-1.28-.09,.43-.18,.85-.28,1.28-.1,.43-.22,.85-.36,1.28l-11.75,34.4c-.17,.6-.51,.89-1.02,.89h-2.85l-14.18-42.37Z' /%3e%3cpath fill='%23fff' d='M568.48,205.47c-.85,0-1.38-.4-1.58-1.19l-.6-5.41c-1.16,1.13-2.32,2.16-3.47,3.07-1.15,.91-2.35,1.67-3.6,2.3-1.25,.62-2.6,1.1-4.05,1.43-1.45,.33-3.04,.49-4.77,.49-1.45,0-2.85-.21-4.22-.64-1.36-.43-2.57-1.08-3.62-1.96-1.05-.88-1.89-2.01-2.53-3.39-.64-1.38-.96-3.03-.96-4.96,0-1.79,.51-3.45,1.53-4.98,1.02-1.53,2.62-2.87,4.79-4,2.17-1.14,4.97-2.04,8.39-2.73,3.42-.68,7.53-1.08,12.33-1.19v-4.43c0-3.92-.84-6.93-2.53-9.05-1.69-2.11-4.19-3.17-7.52-3.17-2.04,0-3.78,.28-5.22,.85-1.43,.57-2.65,1.19-3.64,1.87-.99,.68-1.8,1.31-2.43,1.87-.62,.57-1.15,.85-1.58,.85-.57,0-.99-.25-1.28-.77l-.72-1.23c2.21-2.21,4.54-3.89,6.98-5.02,2.44-1.14,5.21-1.7,8.3-1.7,2.27,0,4.26,.36,5.96,1.09s3.11,1.76,4.24,3.11c1.12,1.35,1.97,2.98,2.53,4.9,.57,1.92,.85,4.05,.85,6.41v27.59h-1.62Zm-17.03-2.26c1.65,0,3.16-.18,4.54-.53,1.38-.35,2.65-.85,3.83-1.49s2.28-1.4,3.3-2.28c1.02-.88,2.03-1.83,3.02-2.85v-11.03c-4.03,.11-7.5,.42-10.41,.92s-5.31,1.17-7.2,2.02-3.28,1.87-4.17,3.04c-.89,1.18-1.34,2.52-1.34,4.02,0,1.42,.23,2.65,.7,3.68,.47,1.04,1.09,1.89,1.85,2.55,.77,.67,1.66,1.16,2.68,1.47,1.02,.31,2.09,.47,3.19,.47Z' /%3e%3cpath fill='%23fff' d='M603.74,205.47v-42.37h2.13c.48,0,.83,.1,1.04,.3,.21,.2,.33,.54,.36,1.02l.34,8.94c1.36-3.43,3.18-6.12,5.45-8.07,2.27-1.94,5.07-2.92,8.39-2.92,1.28,0,2.45,.13,3.53,.4s2.1,.66,3.07,1.17l-.55,2.81c-.09,.45-.37,.68-.85,.68-.17,0-.41-.06-.72-.17-.31-.11-.7-.24-1.17-.38s-1.04-.27-1.72-.38c-.68-.11-1.46-.17-2.34-.17-3.21,0-5.84,.99-7.9,2.98-2.06,1.99-3.73,4.85-5,8.6v27.55h-4.04Z' /%3e%3cpath fill='%23fff' d='M668.25,162.42c2.38,0,4.59,.41,6.62,1.23s3.79,2.02,5.28,3.6c1.49,1.57,2.65,3.51,3.49,5.81,.84,2.3,1.26,4.94,1.26,7.92,0,.63-.09,1.05-.28,1.28s-.47,.34-.87,.34h-30.57v.81c0,3.18,.37,5.98,1.11,8.39,.74,2.41,1.79,4.44,3.15,6.07,1.36,1.63,3.01,2.86,4.94,3.68,1.93,.82,4.09,1.23,6.47,1.23,2.13,0,3.97-.23,5.54-.7s2.87-.99,3.94-1.57c1.06-.58,1.91-1.11,2.53-1.58s1.08-.7,1.36-.7c.37,0,.65,.14,.85,.43l1.11,1.36c-.68,.85-1.58,1.65-2.7,2.38-1.12,.74-2.37,1.37-3.75,1.89s-2.85,.94-4.43,1.26c-1.58,.31-3.16,.47-4.75,.47-2.9,0-5.54-.5-7.92-1.51s-4.43-2.48-6.14-4.41c-1.71-1.93-3.03-4.29-3.96-7.09-.93-2.8-1.4-6-1.4-9.6,0-3.04,.43-5.84,1.3-8.41,.87-2.57,2.11-4.78,3.75-6.64,1.63-1.86,3.63-3.31,6-4.36,2.37-1.05,5.06-1.58,8.07-1.58Zm.06,3.02c-2.18,0-4.14,.34-5.87,1.02-1.73,.68-3.22,1.66-4.49,2.94-1.26,1.28-2.28,2.81-3.06,4.6-.78,1.79-1.3,3.79-1.55,6h27.89c0-2.27-.31-4.31-.93-6.11-.62-1.8-1.5-3.33-2.64-4.58s-2.49-2.21-4.08-2.87c-1.59-.67-3.34-1-5.27-1Z' /%3e%3c/g%3e%3cpath fill='url(%23BLAST)' fill-rule='evenodd' d='M4.12,92.96c-1.43-.39-2.64-1.32-3.38-2.6-.74-1.28-.93-2.8-.55-4.23,.39-1.43,1.32-2.64,2.6-3.38,1.28-.74,2.8-.93,4.23-.55l50.57,13.55h0c3.17,.87,6.52,.91,9.71,.08l.28-.07c3.05-.91,5.82-2.58,8.05-4.86l.02,.02L156.93,9.65c1.05-1.05,2.46-1.63,3.94-1.63s2.9,.59,3.94,1.63c1.05,1.05,1.63,2.46,1.63,3.94s-.59,2.9-1.63,3.94L83.55,98.8v.02c-3.58,3.64-8.06,6.28-12.98,7.69-.13,.04-.25,.08-.38,.12-5.07,1.34-10.4,1.31-15.46-.09h0S4.12,92.96,4.12,92.96Zm18.81-18.77l25.88,6.93c5.06,1.41,10.4,1.43,15.47,.08,5.07-1.36,9.69-4.05,13.37-7.79l33.19-33.19c1.05-1.05,1.64-2.48,1.64-3.96s-.59-2.91-1.64-3.96-2.48-1.64-3.96-1.64-2.91,.59-3.96,1.64l-33.19,33.19c-2.47,2.47-5.32,4.13-8.36,4.95-3.04,.81-6.33,.8-9.69-.1l-25.87-6.93c-.71-.2-1.46-.26-2.2-.17-.74,.09-1.45,.32-2.09,.69-.65,.37-1.21,.86-1.66,1.45-.45,.59-.79,1.26-.98,1.98-.19,.72-.24,1.47-.14,2.2,.1,.74,.35,1.44,.73,2.08,.38,.64,.88,1.2,1.47,1.64,.6,.44,1.27,.76,1.99,.94Zm101.03,124.93l-13.55-50.57c-.88-3.17-.92-6.52-.09-9.7l.07-.29c.9-3.05,2.57-5.83,4.84-8.06L196.5,49.22c1.05-1.05,1.63-2.46,1.63-3.94s-.59-2.9-1.63-3.94c-1.05-1.05-2.46-1.63-3.94-1.63-1.48,0-2.9,.59-3.94,1.63L107.36,122.6c-3.65,3.59-6.3,8.06-7.71,12.97-.04,.13-.08,.25-.12,.38-1.34,5.07-1.31,10.4,.09,15.46h.01l13.56,50.61c.39,1.43,1.32,2.64,2.6,3.38,1.28,.74,2.8,.93,4.23,.55,1.43-.39,2.64-1.32,3.38-2.6,.74-1.28,.93-2.8,.55-4.23h0Zm18.79-18.79l-6.93-25.86c-.88-3.17-.92-6.52-.09-9.71l.07-.28c.91-3.05,2.58-5.82,4.86-8.05l33.2-33.19c1.05-1.05,1.64-2.48,1.64-3.96s-.59-2.91-1.64-3.96c-1.05-1.05-2.48-1.64-3.96-1.64s-2.91,.59-3.96,1.64l-33.18,33.2c-3.64,3.6-6.29,8.07-7.69,12.99-.04,.12-.08,.25-.12,.38-1.34,5.07-1.31,10.4,.09,15.46h.01l6.94,25.9c.19,.71,.52,1.37,.97,1.95,.45,.58,1,1.07,1.64,1.43,.63,.37,1.34,.6,2.06,.7,.73,.09,1.46,.04,2.17-.15,.71-.19,1.37-.52,1.95-.97s1.07-1,1.43-1.64c.36-.63,.6-1.34,.69-2.06,.09-.73,.04-1.46-.15-2.17h0ZM185.84,12.4L16.74,181.48c-1.05,1.05-1.64,2.48-1.64,3.96s.59,2.91,1.64,3.96c1.05,1.05,2.48,1.64,3.96,1.64s2.91-.59,3.96-1.64L193.75,20.31c1.03-1.05,1.6-2.47,1.59-3.94-.01-1.47-.6-2.88-1.64-3.92-1.04-1.04-2.45-1.63-3.92-1.64-1.47-.01-2.89,.56-3.94,1.59ZM51.18,115.37L15.8,150.75c-1.05,1.05-1.64,2.48-1.64,3.96,0,1.49,.59,2.91,1.64,3.96,1.05,1.05,2.48,1.64,3.96,1.64,1.49,0,2.91-.59,3.96-1.64l35.37-35.38c.52-.52,.93-1.14,1.22-1.82,.28-.68,.43-1.41,.43-2.14s-.14-1.47-.43-2.15c-.28-.68-.69-1.3-1.22-1.82-.52-.52-1.14-.93-1.82-1.22-.68-.28-1.41-.43-2.15-.43s-1.47,.15-2.15,.43c-.68,.28-1.3,.7-1.82,1.22v.02Zm31.7,31.68l-35.38,35.39c-1.05,1.05-1.64,2.48-1.64,3.96,0,1.49,.59,2.91,1.64,3.96,1.05,1.05,2.48,1.64,3.96,1.64,1.49,0,2.91-.59,3.96-1.64l35.37-35.39c1.03-1.06,1.6-2.47,1.59-3.94-.01-1.47-.6-2.88-1.64-3.92s-2.45-1.63-3.92-1.64c-1.47,0-2.89,.56-3.94,1.59Z' /%3e%3c/g%3e%3cpath fill='%23fff' d='M679.92,14.02c0-1.29,.17-2.53,.5-3.73,.33-1.19,.8-2.31,1.41-3.35,.61-1.04,1.34-1.98,2.19-2.83,.85-.85,1.8-1.58,2.84-2.19,1.03-.61,2.15-1.08,3.33-1.42,1.19-.33,2.43-.5,3.72-.5s2.53,.17,3.73,.5c1.19,.33,2.31,.8,3.34,1.42,1.04,.61,1.98,1.34,2.84,2.19s1.59,1.79,2.19,2.83c.61,1.04,1.08,2.16,1.41,3.35,.33,1.19,.5,2.44,.5,3.73s-.17,2.51-.5,3.71c-.33,1.19-.8,2.31-1.41,3.34-.61,1.03-1.34,1.98-2.19,2.83-.86,.85-1.8,1.58-2.84,2.19-1.03,.61-2.15,1.09-3.34,1.42-1.2,.33-2.44,.5-3.73,.5s-2.53-.17-3.72-.5c-1.19-.33-2.3-.8-3.33-1.42-1.04-.61-1.98-1.34-2.84-2.19-.86-.85-1.59-1.79-2.19-2.83-.61-1.03-1.08-2.14-1.41-3.33-.33-1.19-.5-2.43-.5-3.72Zm1.92,0c0,1.14,.14,2.23,.42,3.28,.28,1.05,.68,2.03,1.21,2.94,.52,.91,1.15,1.74,1.88,2.48,.73,.74,1.54,1.38,2.43,1.91s1.86,.94,2.89,1.23c1.04,.29,2.11,.43,3.24,.43,1.69,0,3.27-.32,4.74-.96s2.76-1.51,3.85-2.61c1.09-1.1,1.96-2.4,2.59-3.89,.63-1.49,.95-3.09,.95-4.8,0-1.14-.14-2.23-.43-3.29-.29-1.06-.69-2.05-1.22-2.96s-1.15-1.75-1.89-2.5c-.73-.75-1.55-1.39-2.44-1.92-.89-.53-1.86-.94-2.9-1.24-1.04-.29-2.12-.44-3.25-.44-1.69,0-3.26,.32-4.73,.97-1.47,.65-2.75,1.53-3.83,2.64-1.09,1.12-1.94,2.43-2.57,3.93s-.94,3.11-.94,4.82Zm9.31,1.72v6.78h-2.99V5.44h5.52c2.2,0,3.83,.4,4.89,1.2s1.59,1.97,1.59,3.53c0,1.2-.34,2.22-1.03,3.06s-1.7,1.42-3.06,1.74c.22,.13,.41,.29,.57,.48s.31,.42,.45,.67l4.37,6.4h-2.84c-.42,0-.73-.16-.94-.48l-3.85-5.78c-.11-.17-.25-.29-.41-.38-.16-.09-.41-.13-.74-.13h-1.53Zm0-2.18h2.22c.7,0,1.3-.07,1.79-.2,.49-.13,.89-.33,1.19-.58,.3-.26,.52-.57,.65-.94,.13-.37,.2-.8,.2-1.28s-.06-.89-.18-1.25c-.12-.36-.32-.65-.59-.88s-.64-.4-1.08-.52c-.45-.11-1-.17-1.67-.17h-2.53v5.82Z' /%3e%3c/svg%3e)
Rocket® TMON® Stream: A Faster Path to Mainframe Observability

Anyone who has worked with the mainframe for a while knows the drill: when performance matters, you go to TMON. Whether that means watching key metrics on 3270 panels, keeping auto‑refreshing screens open during a busy window, or digging into historical data after the fact, TMON is where the answers live.
What’s been harder is getting that same insight in front of everyone else who needs it, fast enough to matter. TMON Stream was built from customer conversations about that exact challenge. It doesn’t replace the tools you already trust; it changes how TMON data moves through your organization so more people can see it, understand it, and act on it.
The reality today: solid data, limited reach
Most organizations use TMON in a few familiar ways:
- Live monitoring on 3270. Auto‑refreshing screens show CPU activity, workload behavior, response times, DB2® activity, queue depths, and more. During peak periods or change windows, these act as your system’s heartbeat.
- Post‑incident analysis. After an event, teams review collected data using Report Writer, ad hoc TMON Query, or hands‑on expertise to understand what happened and reduce the risk of repeat incidents.
These approaches work, and they remain essential. The challenge isn’t data volume. TMON has never been short on insight. The challenge is that this information is often:
- Tied to specific interfaces
- Held by a small number of experts
- Difficult to share or correlate with what other teams are seeing
In an environment where incidents routinely cross platforms, those limits slow teams down.
The friction: different teams, different tools, different stories
A slowdown might start in the application tier, surface in DB2, and ultimately show up as CPU pressure on z/OS®. While that’s happening:
- The mainframe team is monitoring TMON on 3270.
- Application and SRE teams are watching cloud or distributed dashboards.
- Each group is working from different tools, timelines, and assumptions.
Mainframe behavior is visible, just not to the people looking at those distributed dashboards. Or it’s available only later, after data has been exported or reports have been built. That gap leads to mainframe teams being asked to explain events after the fact, other teams seeing only symptoms, and correlation happening in conference calls instead of on a shared screen.
TMON Stream closes that gap.
What TMON Stream does
TMON Stream doesn’t change how TMON collects data. It doesn’t replace 3270 screens, reports, or established workflows. What it does change is how that data flows across your organization, and how it can be analyzed.
With TMON Stream:
- Performance data from z/OS subsystems is streamed continuously to non‑mainframe destinations.
- Trusted TMON metrics are exposed in near real time to modern analytics and observability platforms.
- The same data can be visualized, correlated, and shared across teams and tools.
Think of it as extending the reach of TMON, not redefining it. Mainframe experts keep the views they rely on, while everyone else gains timely, contextual visibility into mainframe behavior using the tools they already know.
Why this matters - even if you prefer 3270 screens
Many system programmers rely on 3270 views for good reason. They’re fast, familiar, and efficient. TMON Stream doesn’t take that away. Instead, it adds another option when you need:
- Persistent visibility that doesn’t depend on someone keeping a session open
- Visual trends and anomalies that stand out without stitching together multiple refreshes or reports
- “Right now” and “what’s normal” shown side by side
- A clearer way to explain mainframe behavior to teams that don’t work on z/OS every day
- TMON data feeding analytics, visualization, and automation platforms
You no longer have to choose between the speed of 3270 and the shareability of modern dashboards. You can have both.
Rocket Data Gateway: the bridge that makes it possible
TMON Stream relies on Rocket® Data Gateway, which acts as the bridge between TMON and the rest of your analytics environment. It takes performance metrics from z/OS subsystems and makes them available to downstream platforms for storage, visualization, and analysis.
The gateway handles the mechanics, allowing TMON to continue doing what it does best while its data becomes accessible wherever it’s needed.
Dashboards that highlight what really matters
TMON Stream includes sample dashboards for each supported subsystem. They’re designed to surface the behaviors mainframe teams already care about presented in a format that’s easier to share and explore.
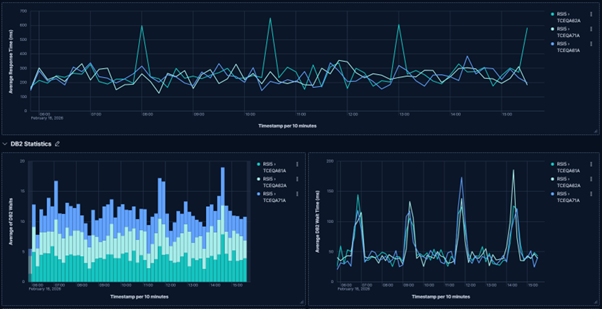
TMON CICS® Transaction Performance History — Response Time vs. DB2 Wait Time
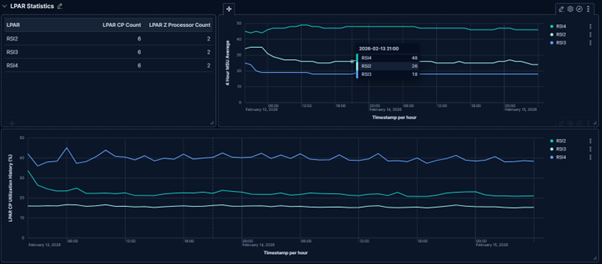
TMON z/OS System Activity — LPAR Utilization
Some customers use these dashboards as an additional lens alongside traditional 3270 monitoring. Others use them to show system behavior during incidents or in post‑event reviews. The real value isn’t the dashboard itself, it’s the shared visibility and faster understanding it enables.
Ready to experience it?
TMON Stream extends the value of your existing TMON investment by making performance data easier to share, easier to visualize, and easier to correlate across your environment. The result is stronger observability without disrupting how your teams work today.
Want to see what this looks like with your systems, your tools, and your use cases? Contact Rocket Software to schedule a conversation or demo and explore how TMON Stream can help your teams move faster with fewer blind spots.
Related content
Modernizing the Enterprise with the IBM z17 Single Frame & Rack-Mounted Systems
Related posts
Technical Debt Management Solutions
Why TMON Health AI is the Missing Link in Your Performance monitoring
AI Innovations